 Stay
Stay 
Trading Conditions
Products
Tools


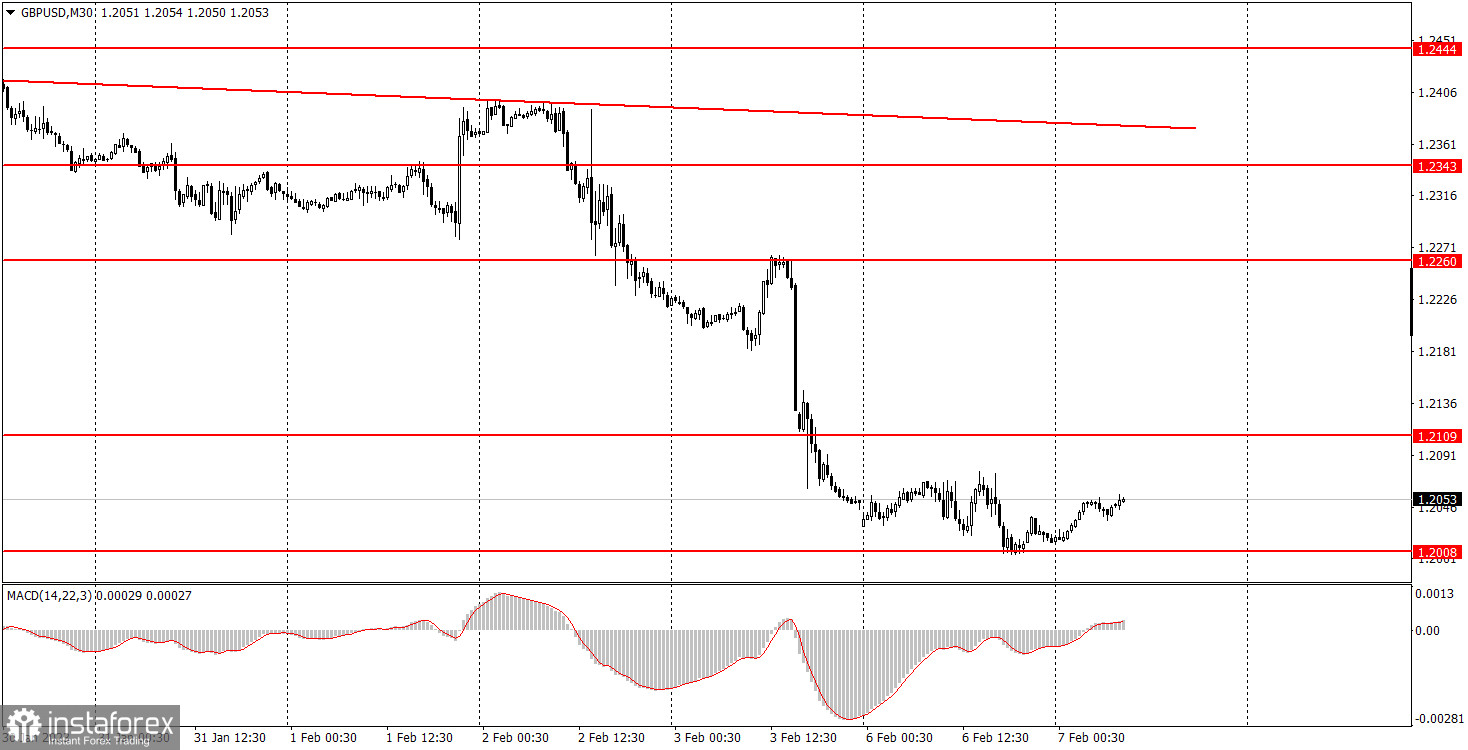
GBP/USD tried to continue the downward movement on Monday, but failed to cross 1.2008. It also failed to enter a strong bullish correction so the pair was flat for most of the day. A correction would be the most logical scenario, however, the pair might continue falling, since the current momentum might persist after Thursday and Friday's impact. There was no important macro data in Britain and the US on Monday. The only thing that was worth paying attention to was the UK Construction PMI, which did not affect the pair's movement. Thus, the market is still influenced by the outcome of the meetings of the Bank of England and the Federal Reserve, as well as the labor market and the unemployment data in the US. The ascending trend line is a signal of a downtrend, but it is quite formal. It has too small slope angle and the price is located very far from it.

Since yesterday's movement was predominantly sideways, the trading signals were not quite good. In total, the pair formed two sell signals near the area of 1.2064-1.2079. In the first case, it passed 30 pips in the right direction (i.e. down), and 45 pips in the second one. However, it failed to reach the nearest target level of 1.1957, therefore, it was only possible to make profit using these signals if they were closed manually. This was exactly the way to act on the second trade, since there was no buy signal until the evening, and the short position had to be closed somehow. Therefore, you could gain about 45 pips of profit at the second short position, which made it possible to cover losses at trades with EUR/USD. Thus, Monday turned out to be neutral.
On the 30-minute chart, GBP/USD continues to form a downtrend and may continue the downward movement. Fundamental and macroeconomic factors will be weak this week, so the pound has to look after itself. On the 5-minute chart, it is recommended to trade at the levels 1.1863-1.1877, 1.1950-1.1957, 1.2064-1.2079, 1.2109, 1.2171-1.2179, 1.2245-1.2260. As soon as the price passes 20 pips in the right direction, you should set a Stop Loss to breakeven. On Tuesday, Bank of England representatives will deliver speeches. There will be nothing interesting in the U.S.. Therefore, traders will have nothing to react to.
1) The strength of the signal is determined by the time it took the signal to form (a rebound or a breakout of the level). The quicker it is formed, the stronger the signal is.
2) If two or more positions were opened near a certain level based on a false signal (which did not trigger a Take Profit or test the nearest target level), then all subsequent signals at this level should be ignored.
3) When trading flat, a pair can form multiple false signals or not form them at all. In any case, it is better to stop trading at the first sign of a flat movement.
4) Trades should be opened in the period between the start of the European session and the middle of the US trading hours when all positions must be closed manually.
5) You can trade using signals from the MACD indicator on the 30-minute time frame only amid strong volatility and a clear trend that should be confirmed by a trendline or a trend channel.
6) If two levels are located too close to each other (from 5 to 15 pips), they should be considered support and resistance levels.
Support and Resistance levels are the levels that serve as targets when buying or selling the pair. You can place Take Profit near these levels.
Red lines are channels or trend lines that display the current trend and show in which direction it is better to trade now.
The MACD indicator (14, 22, and 3) consists of a histogram and a signal line. When they cross, this is a signal to enter the market. It is recommended to use this indicator in combination with trend patterns (channels and trendlines).
Important announcements and economic reports that can be found on the economic calendar can seriously influence the trajectory of a currency pair. Therefore, at the time of their release, we recommend trading as carefully as possible or exiting the market in order to avoid sharp price fluctuations.
Beginners on Forex should remember that not every single trade has to be profitable. The development of a clear strategy and money management is the key to success in trading over a long period of time.
InstaForex analytical reviews will make you fully aware of market trends! Being an InstaForex client, you are provided with a large number of free services for efficient trading.


