 Stay
Stay 
Trading Conditions
Products
Tools


The UK construction PMI for January came out worse than expected, at 48.4, slightly lower than previous month's 48.8. The estimated figure was 49.6.
The construction sector is an important component of the British economy. The pound sterling was under pressure from sellers.
The European retail sales declined to 2.8% year-on-year, with an expectation of 2.6%.
This result disappointed investors; the euro continued to decline.
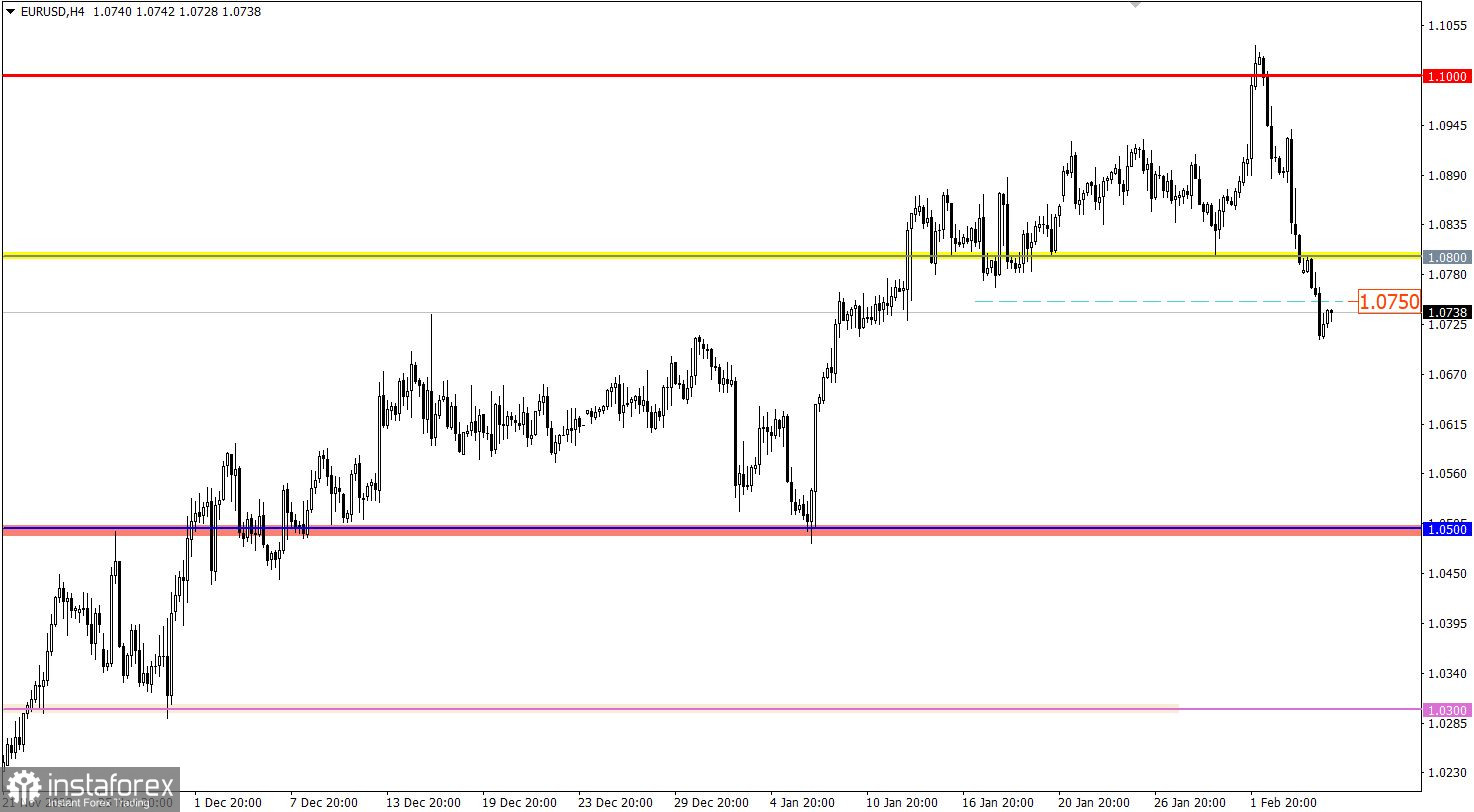
The EURUSD currency pair not only managed to maintain its inertia despite the technical signal that the euro was oversold, it managed to stay below the value of 1.0750. In fact, this step indicated the subsequent formation of a corrective move from the peak of the upward trend.
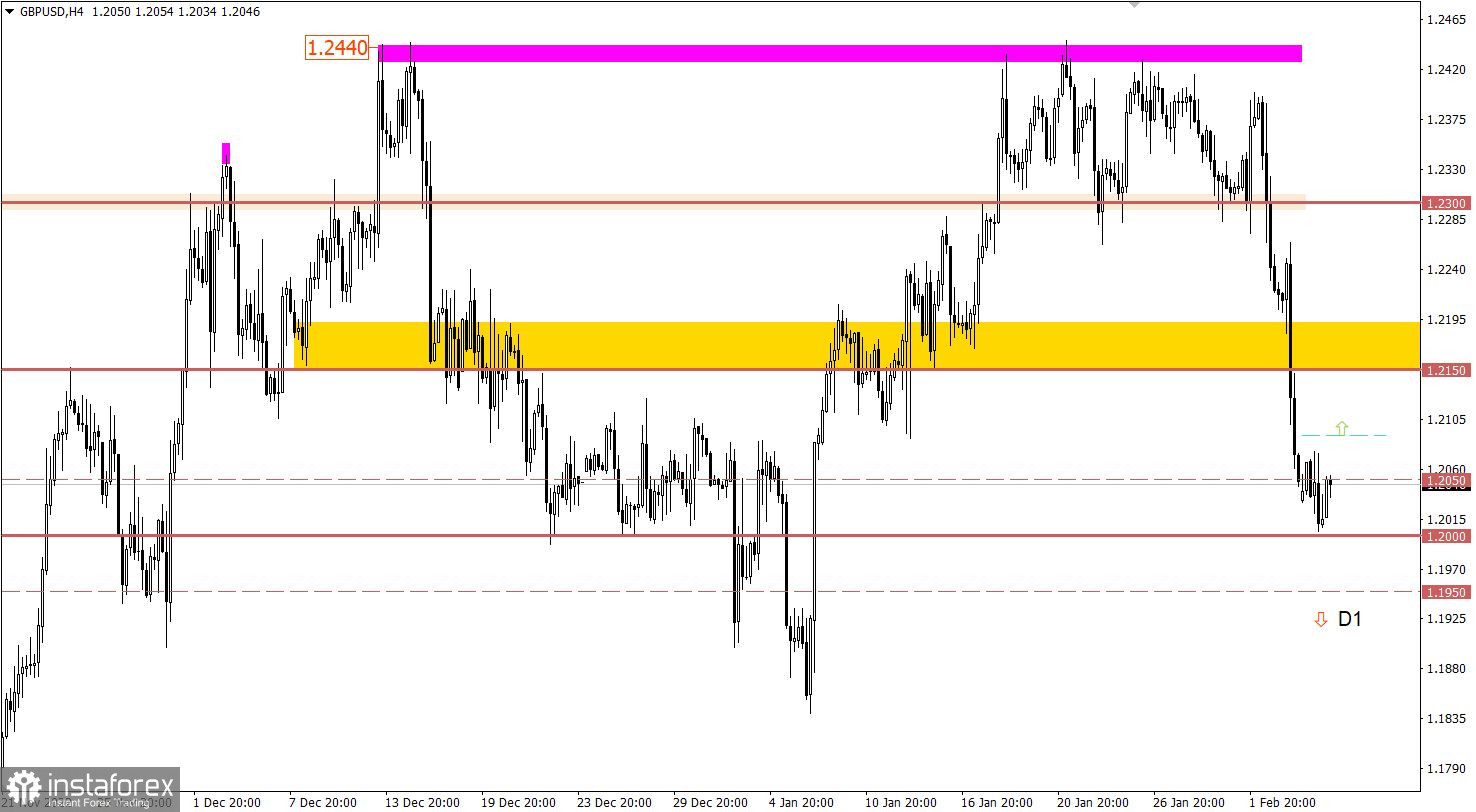
The GBPUSD currency pair has slowed down its downward movement around the 1.2000 psychological level. As a result, the inertial cycle was interrupted, and a stagnant pullback occurred on the market.

Today, the macroeconomic calendar is empty. No important reports are expected in the EU, the United Kingdom, and the Unites States.
In this regard, investors and traders will be guided by the incoming information and news flow. Federal Reserve Chairman Jerome Powell will address the Economic Club of Washington today at 17:40 UTC. Markets, as always, are waiting for hints on monetary policy.
There are 43 days left until the next FOMC meeting.
The scale of the weakening of the euro for three trading days is about 300 points, which is an atypical movement in the market. The characteristic speculative interest ignores technical signals, which allows further inertia to form. In this case, the subsequent downward move is possible in the market, but it is still not considered the starting point for a change in the current medium-term trend. For trading interests to change, the quote needs to stay below the level of 1.0500 in the daily period.
However, note that overheating of short positions in the euro will sooner or later lead to their fixation. This, in turn, allows a technical pullback relative to the current inertial move.
The scale of the weakening of the pound sterling for three trading days is more than 350 points. The current price stagnation is a justified decision due to the characteristic oversold signal in the market. In this situation, keeping the price above 1.2090 may lead to a partial recovery of the British pound towards 1.2150/1.2200. While keeping the price below the value of 1.1950 allows the subsequent construction of an inertial move.
The candlestick chart type is white and black graphic rectangles with lines above and below. With a detailed analysis of each individual candle, you can see its characteristics relative to a particular time frame: opening price, closing price, intraday high and low.
Horizontal levels are price coordinates, relative to which a price may stop or reverse its trajectory. In the market, these levels are called support and resistance.
Circles and rectangles are highlighted examples where the price reversed in history. This color highlighting indicates horizontal lines that may put pressure on the asset's price in the future.
The up/down arrows are landmarks of the possible price direction in the future.
InstaForex analytical reviews will make you fully aware of market trends! Being an InstaForex client, you are provided with a large number of free services for efficient trading.


