 Stay
Stay 
Trading Conditions
Products
Tools


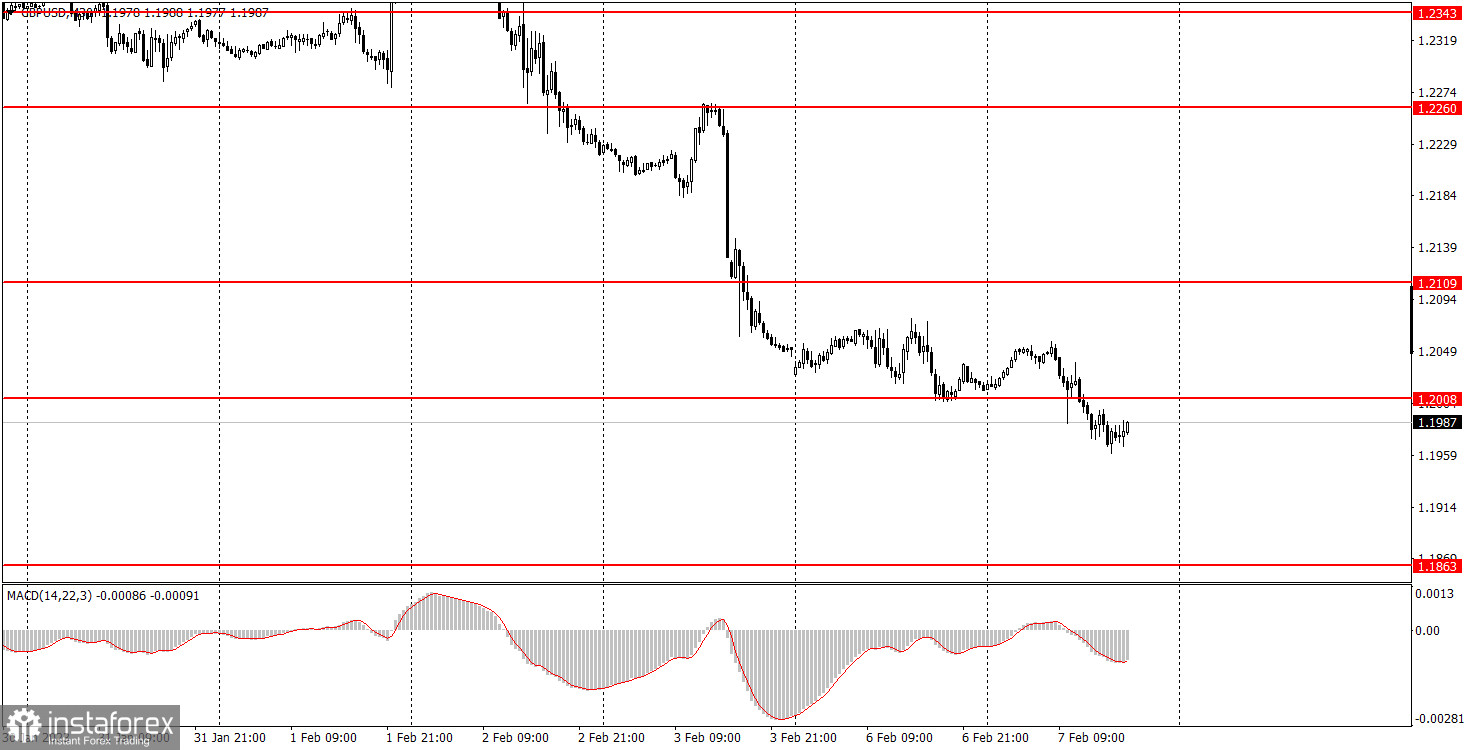
GBP/USD continues to slowly edge down on Tuesday. The pound started to fall last Thursday, and it slowed down on Monday and Tuesday due to the lack of fundamental and macroeconomic events, but in general, it is still falling. This is the scenario I predicted. Now the pair can aim for 1.1863, but at the same time, it might be good to start a bit of a bullish correction after the four-day plunge. This week, the most important report for the UK will be released on Friday. Until then, traders will only have minor reports at their disposal, which are unlikely to affect the mood of the market. Consequently, the general trend should not change. I believe that GBP will edge up this week, and afterwards, it will fall again. The British pound was rising for many months, but it cannot go on like that forever. The market has already worked out all the bullish factors of the British pound several times.
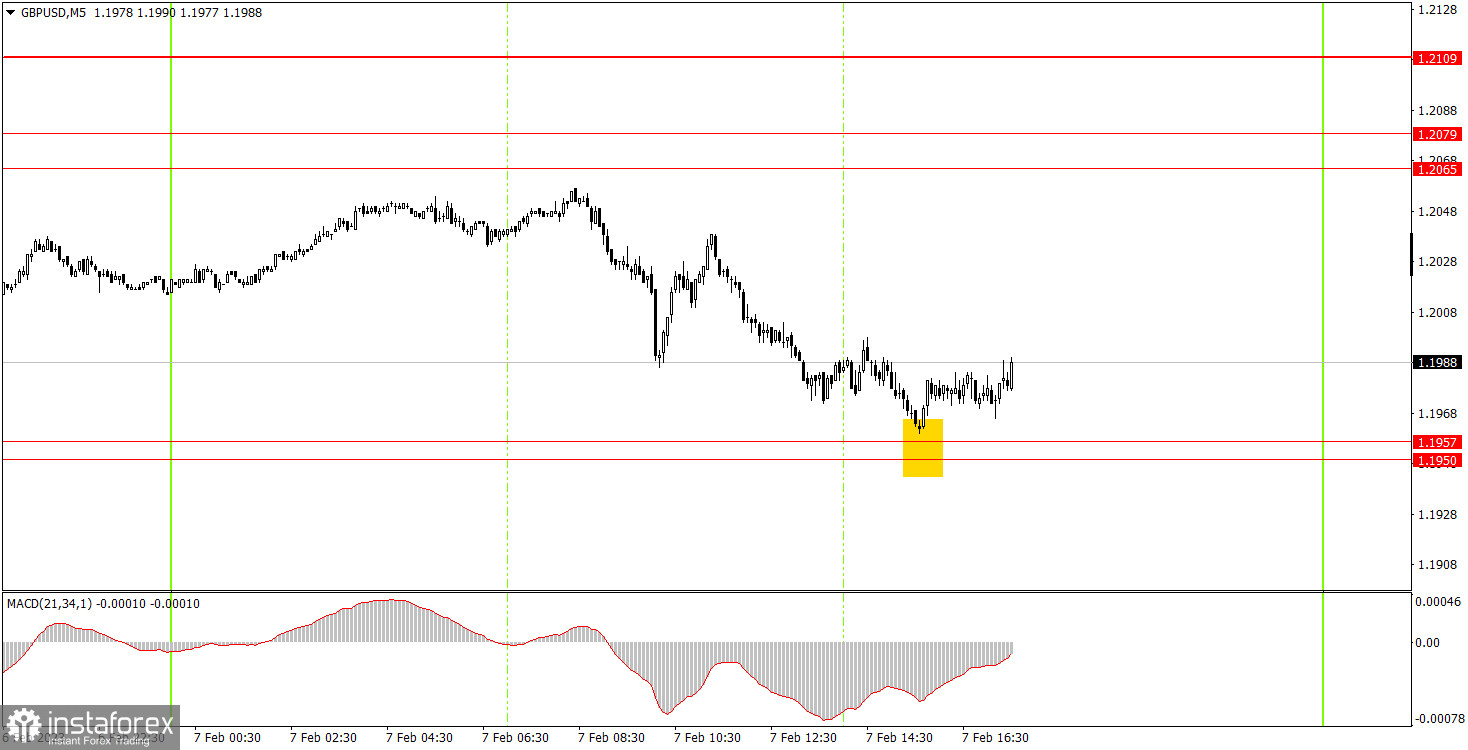
Tuesday's movements were very good, but traders were just a little unlucky. At the beginning of the European trading session, the price was near 1.2065, but still fell short of reaching it by about 7 points. This cannot be considered as an error, so a short position should not have been opened. In the course of the day, the pair fell to 1.1957, which it also missed by only 3 pips. But in this case, it was already possible to consider this as a buy signal with an error. Beginners could open a long position using this signal, and till the evening, the pair went up about 30-40 pips, which could be earned by closing the deal manually. As a result, it was not the worst trading day.
On the 30-minute chart, GBP/USD continues to form a downtrend and can continue the momentum movement on Wednesday. There are few fundamental and macroeconomic factors this week, so the pound will have to look after itself. Technical correction is quite probable this week. On the 5-minute chart, it is recommended to trade at the levels 1.1793, 1.1863-1.1877, 1.1950-1.1957, 1.2064-1.2079, 1.2109, 1.2171-1.2179. As soon as the price passes 20 pips in the right direction, you should set a Stop Loss to breakeven. There are no important events or reports planned for Wednesday in the UK or the US. The pair may start a bullish correction, but volatility is likely to remain low.
1) The strength of the signal is determined by the time it took the signal to form (a rebound or a breakout of the level). The quicker it is formed, the stronger the signal is.
2) If two or more positions were opened near a certain level based on a false signal (which did not trigger a Take Profit or test the nearest target level), then all subsequent signals at this level should be ignored.
3) When trading flat, a pair can form multiple false signals or not form them at all. In any case, it is better to stop trading at the first sign of a flat movement.
4) Trades should be opened in the period between the start of the European session and the middle of the US trading hours when all positions must be closed manually.
5) You can trade using signals from the MACD indicator on the 30-minute time frame only amid strong volatility and a clear trend that should be confirmed by a trendline or a trend channel.
6) If two levels are located too close to each other (from 5 to 15 pips), they should be considered support and resistance levels.
Support and Resistance levels are the levels that serve as targets when buying or selling the pair. You can place Take Profit near these levels.
Red lines are channels or trend lines that display the current trend and show in which direction it is better to trade now.
The MACD indicator (14, 22, and 3) consists of a histogram and a signal line. When they cross, this is a signal to enter the market. It is recommended to use this indicator in combination with trend patterns (channels and trendlines).
Important announcements and economic reports that can be found on the economic calendar can seriously influence the trajectory of a currency pair. Therefore, at the time of their release, we recommend trading as carefully as possible or exiting the market in order to avoid sharp price fluctuations.
Beginners on Forex should remember that not every single trade has to be profitable. The development of a clear strategy and money management is the key to success in trading over a long period of time.
InstaForex analytical reviews will make you fully aware of market trends! Being an InstaForex client, you are provided with a large number of free services for efficient trading.


