 Stay
Stay 
Trading Conditions
Products
Tools


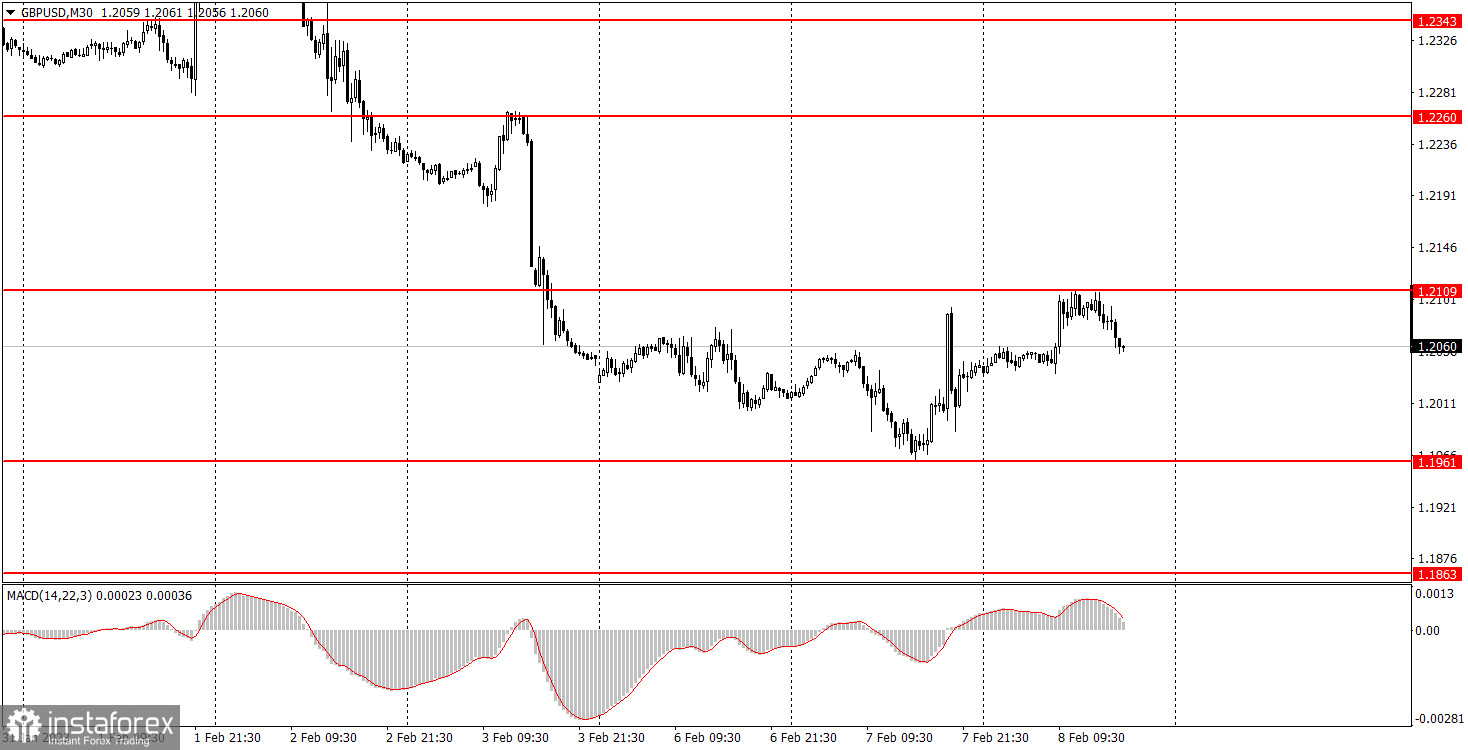
GBP/USD also tried to continue its corrective movement on Thursday, but a new round of downward movement started in the afternoon. So far, the pound cannot decide which way to go after the four-day fall. On the one hand, it should continue to fall, but on the other hand, it needs a bullish correction. And on the other hand, there is a lack of any macro data and fundamental background this week. The pound can count on the influence of macroeconomics only on Friday, when the reports on the industrial production and GDP will be published. Moreover, we don't know what reaction will be triggered as the market keeps paying more attention to the US data and the Federal Reserve. On Tuesday night, a totally ordinary and banal speech made by Fed Chairman Jerome Powell provoked first a 100-point rise and then a 100-point drop. And all within the space of one hour.
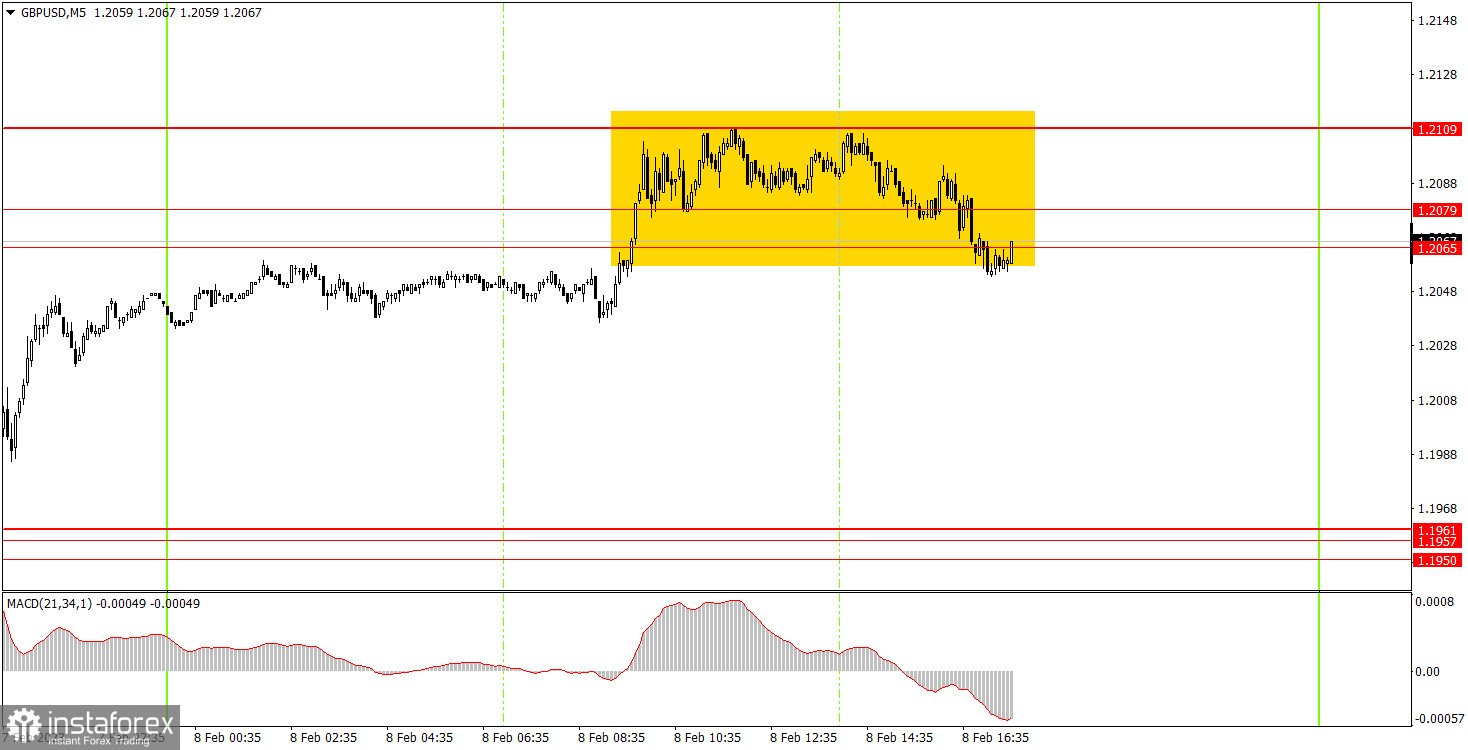
Not a single trade signal was formed on Wednesday. During the European session, the pair reached the 1.2065-1.2109 range, where it spent the entire day. We could try to trade between 1.2079 and 1.2109, but you know that trading in the 30-point range is meaningless. So, today beginners could take a rest. By the way, the movements were very bad, no trend, and the volatility was about 70 points, which is very little for the pound. I already warned you that strong and good moves are unlikely this week. So far, our expectations have come true.
On the 30-minute chart, GBP/USD continues to form a downtrend, but it still tries to correct. The intraday movements are very bad, jagged, weak and unstable. Therefore, it is very difficult to trade at this time. The nature of the pair's movement should be considered when opening any trading positions. On the 5-minute chart, it is recommended to trade at the levels 1.1793, 1.1863-1.1877, 1.1950-1.1957-1.1961, 1.2065-1.2079, 1.2109, 1.2171-1.2179. As soon as the price passes 20 pips in the right direction, you should set a Stop Loss to breakeven. There are no important events planned for Thursday in the UK or the US. Theoretically, the report on the U.S. jobless claims may have an impact, but in practice, it happens very rarely.
1) The strength of the signal is determined by the time it took the signal to form (a rebound or a breakout of the level). The quicker it is formed, the stronger the signal is.
2) If two or more positions were opened near a certain level based on a false signal (which did not trigger a Take Profit or test the nearest target level), then all subsequent signals at this level should be ignored.
3) When trading flat, a pair can form multiple false signals or not form them at all. In any case, it is better to stop trading at the first sign of a flat movement.
4) Trades should be opened in the period between the start of the European session and the middle of the US trading hours when all positions must be closed manually.
5) You can trade using signals from the MACD indicator on the 30-minute time frame only amid strong volatility and a clear trend that should be confirmed by a trendline or a trend channel.
6) If two levels are located too close to each other (from 5 to 15 pips), they should be considered support and resistance levels.
Support and Resistance levels are the levels that serve as targets when buying or selling the pair. You can place Take Profit near these levels.
Red lines are channels or trend lines that display the current trend and show in which direction it is better to trade now.
The MACD indicator (14, 22, and 3) consists of a histogram and a signal line. When they cross, this is a signal to enter the market. It is recommended to use this indicator in combination with trend patterns (channels and trendlines).
Important announcements and economic reports that can be found on the economic calendar can seriously influence the trajectory of a currency pair. Therefore, at the time of their release, we recommend trading as carefully as possible or exiting the market in order to avoid sharp price fluctuations.
Beginners on Forex should remember that not every single trade has to be profitable. The development of a clear strategy and money management is the key to success in trading over a long period of time.
InstaForex analytical reviews will make you fully aware of market trends! Being an InstaForex client, you are provided with a large number of free services for efficient trading.


