 Stay
Stay 
Trading Conditions
Products
Tools


On Wednesday, EUR/USD traded mainly sideways. No fundamental and macroeconomic backgrounds for the day, so traders had nothing to react to. I've already said it before that this week could be boring. In fact, besides the sharp surge during Federal Reserve Chairman Jerome Powell's speech on Tuesday evening, we haven't seen any normal movements yet. First, the pair was falling by momentum, then it stopped falling and now it is trading sideways. So this kind of movement may persist till the end of the week since the amount of reports and events will obviously not increase. I still believe that the pair should correct for a bit (or trade flat for a while), and after that it will go back to falling. The euro is still overbought and a new uptrend will be formed after a significant bearish correction.
Speaking of Wednesday's trading signals, it was not appealing at all. Since the pair was flat for most of the day, the signals were formed accordingly. All of them are near 1.0736. Since all of them were false, traders could try to use only the first two. You could receive about 15 points on the short position, and nothing on the long position, since the price passed 15 points to the upside and the Stop Loss has been triggered at breakeven. Not the best trading day, but it could've been much worse.
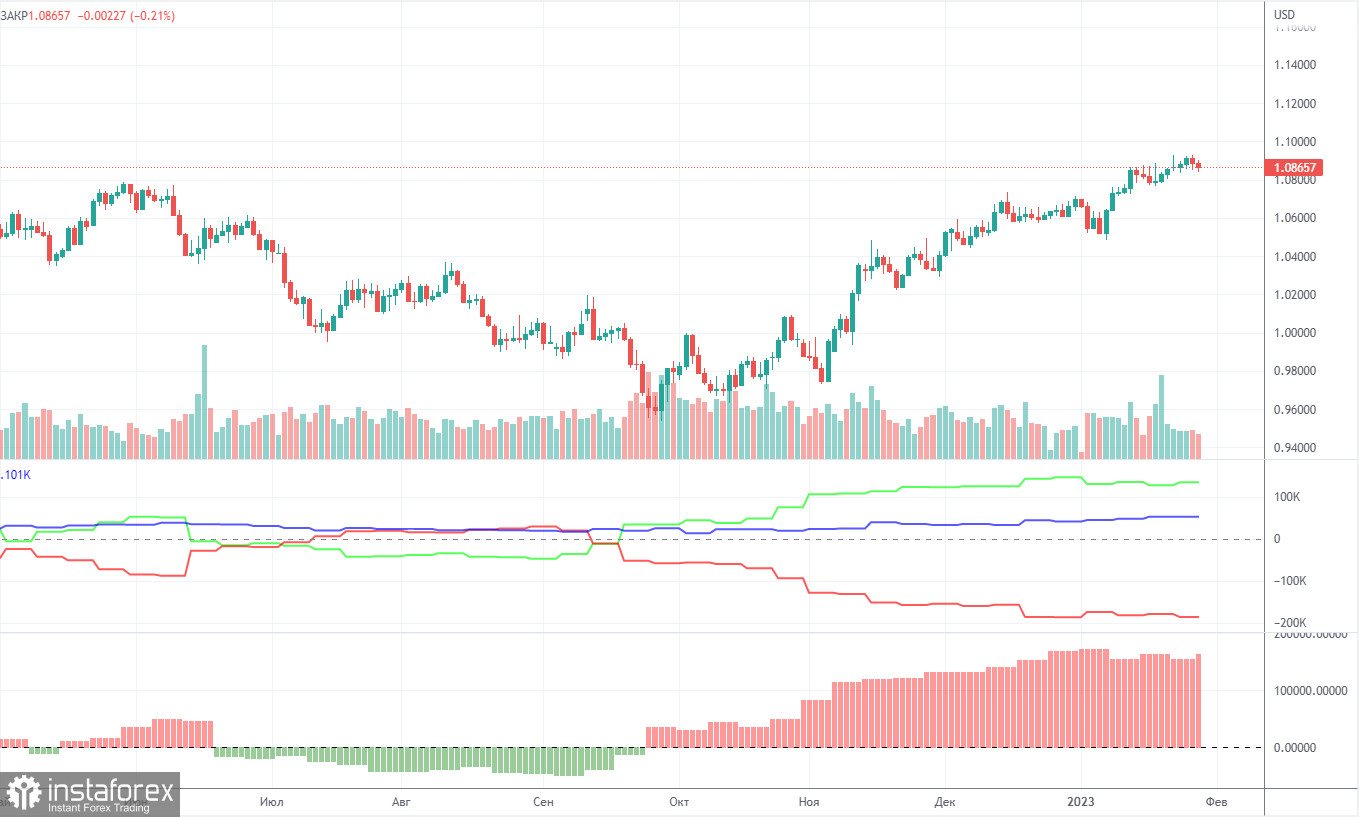
The COT reports on EUR/USD have been in line with expectations in recent months. The net non-commercial position has been on the rise since September. The bullish non-commercial position rises with each new week. Taking into account this fact, we may assume that the uptrend will soon come to an end. The red and green lines of the first indicator are far apart, which is usually a sign of the end of a trend. In the reporting week, non-commercial traders opened 9,500 long positions and 2,000 short ones. The net non-commercial position grew by 7,500. The number of long positions exceeds that of short ones by 134,000. It now remains to be seen how long large traders will be bullish. From the technical point of view, a bearish correction should have already occurred. Traders will unlikely stay bullish for another 2 or 3 months. Even the net non-commercial position shows that it is time for a correction. In total, there are 52,000 more long positions now among all groups of traders (732,000 vs 680,000).
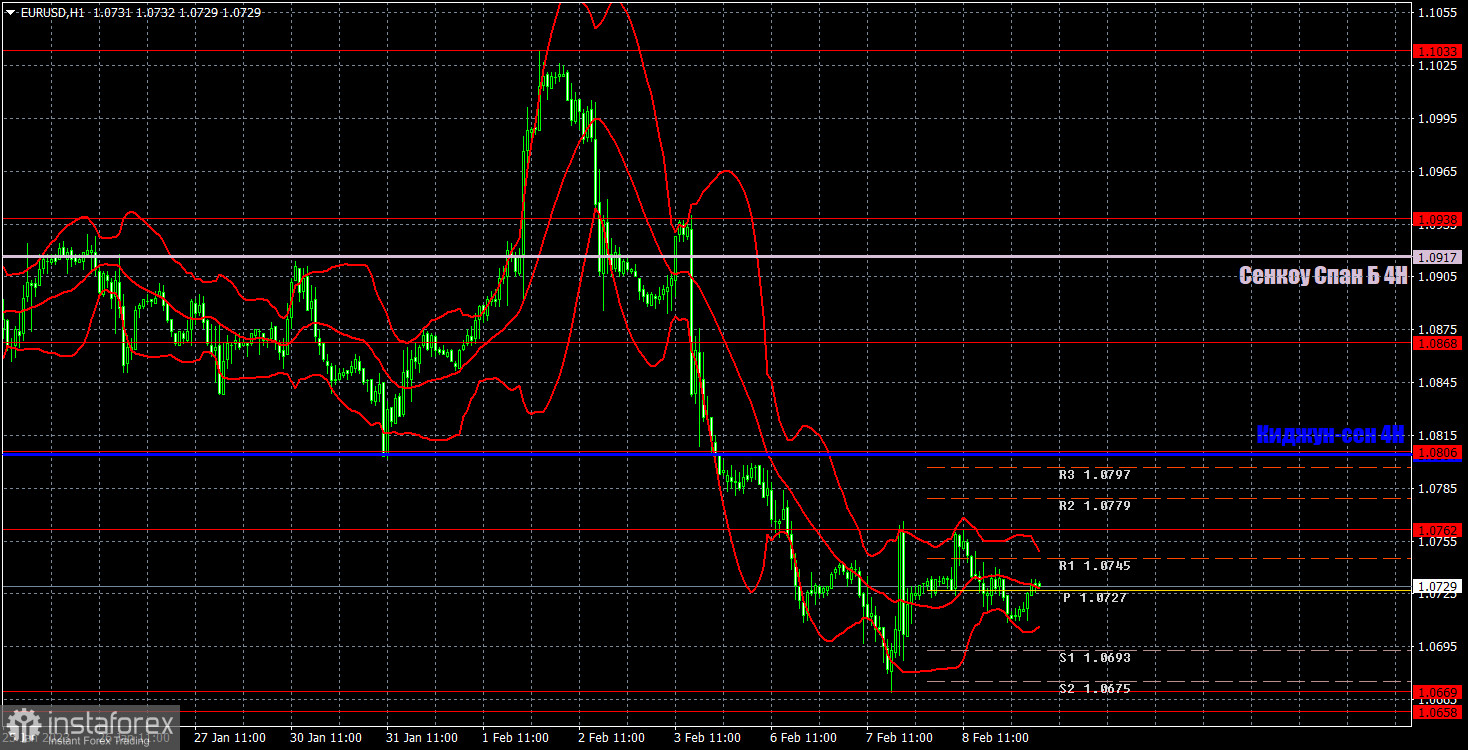
On the one-hour chart, EUR/USD continues to fall. I already warned you that the first days of the week could be moved by momentum, afterwards there were several attempts to correct, but so far the pair is trading more flat than a correctional movement. On Thursday, important levels are seen at: 1.0485, 1.0581, 1.0658-1.0669, 1.0762, 1.0806, 1.0868, 1.0938 and also Senkou Span B (1.0917) and Kijun Sen (1.0804). Lines of the Ichimoku indicator may move during the day, which should be taken into account when determining trading signals. There are also support and resistance levels, but signals are not formed near these levels. Bounces and breakouts of the extreme levels and lines could act as signals. Don't forget about stop-loss orders, if the price covers 15 pips in the right direction. This will prevent you from losses in case of a false signal. No important events in the EU and the US on February 9, unless you consider the trivial unemployment claims report. Today, the pair may remain inside the 1.0669-1.0762 channel.
Price levels of support and resistance are thick red lines, near which the movement may end. They do not provide trading signals.
The Kijun-sen and Senkou Span B lines are the lines of the Ichimoku indicator, moved to the one-hour chart from the 4-hour one. They are strong lines.
Extreme levels are thin red lines from which the price bounced earlier. They provide trading signals.
Yellow lines are trend lines, trend channels, and any other technical patterns.
Indicator 1 on the COT charts reflects the net position size of each category of traders.
Indicator 2 on the COT charts reflects the net position size for the non-commercial group.
InstaForex analytical reviews will make you fully aware of market trends! Being an InstaForex client, you are provided with a large number of free services for efficient trading.


