 Stay
Stay 
Trading Conditions
Products
Tools


Analysis of GBP/USD, 5-minute chart
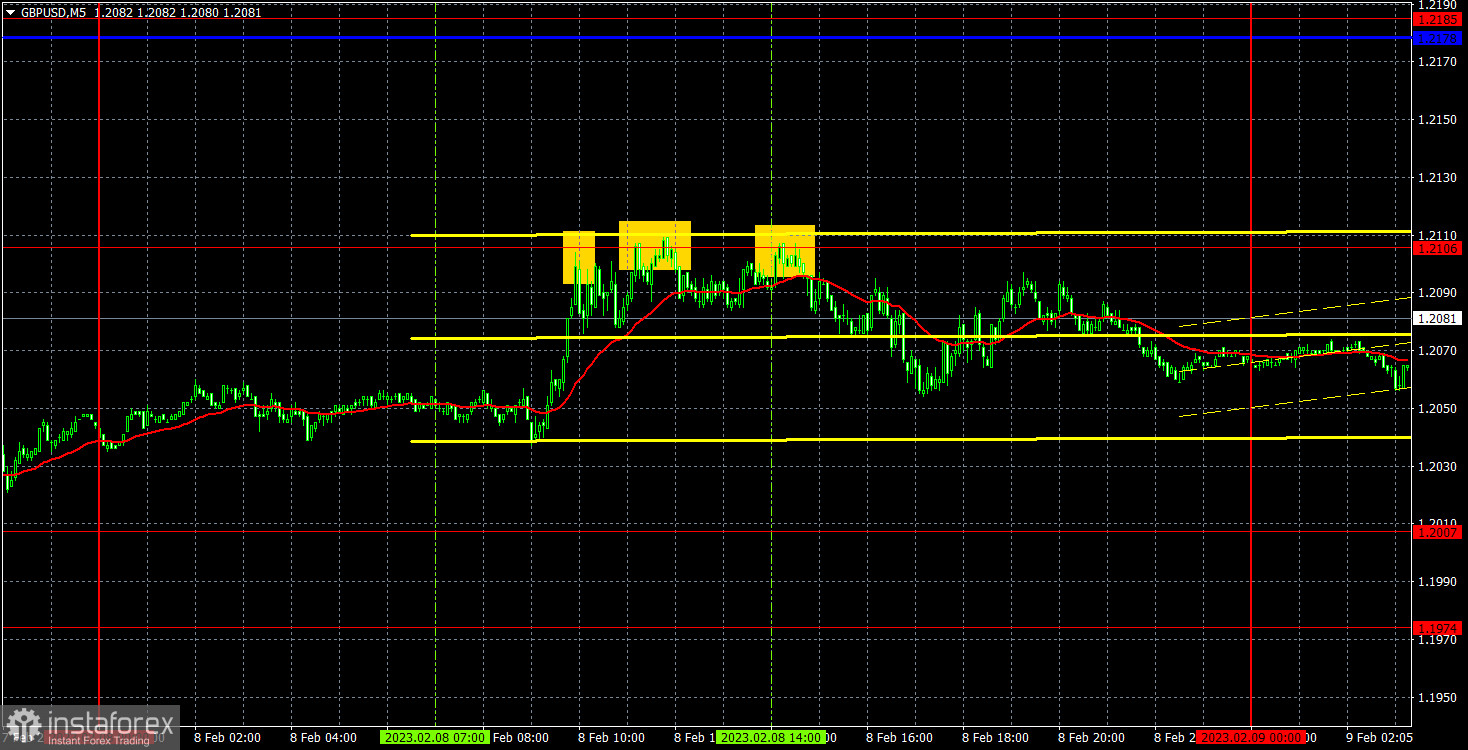
On Wednesday, the pound/dollar pair was mainly trading sideways. Traders priced in all the events of the previous week, including the key interest rate decisions and possible changes in them. The downward inertial movement also stopped. Now, the market needs a new impulse. This could become possible only on Friday when the UK will disclose its GDP data for the fourth quarter. However, the likelihood is really low. In this light, the pair may continue trading sideways and show a slight movement within the channel. Under such conditions, it will be difficult to trade. The volatility is low, which causes additional problems for traders. Yesterday, neither the UK nor the US published a report that could attract traders. Although officials of the Fed and the BoE provide speeches from time to time, they do not give any new information. Traders clearly understand the stance of both regulators. Yesterday, we saw three sell signals near the level of 1.2106. All the signals were accurate. Since the signals were very much alike, it was possible to open only one position. The third attempt allowed the pair to drop by more than 20 pips. Those who closed the position manually received 20-30 pips of profit.
COT report
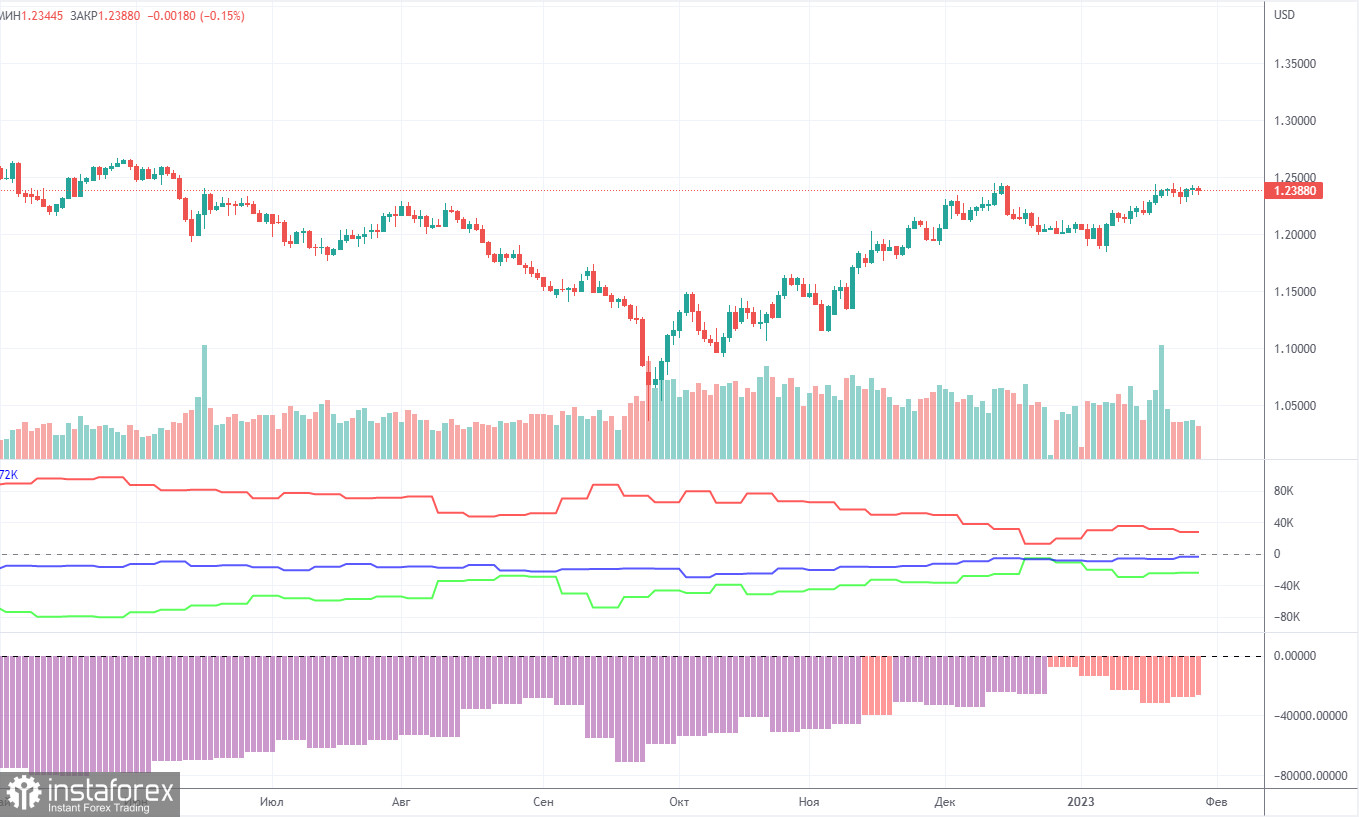
The recent COT report on the pound sterling unveiled that the bearish sentiment became weaker. During the week, non-commercial traders closed 6.7 thousand BUY contracts and 7.5 thousand SELL contracts. Thus, the net position of non-commercial traders increased by 0.8 thousand. During the last few months, the net position was increasing quite stably. The sentiment of big traders could become bullish in the near future. It is still very hard to explain why the pound sterling increased so much against the US dollar. In the mid-term, the British pound could drop as it needs correction. In general, the recent COT reports have been corresponding to the pound's movement. Since the net position is not bullish anymore, traders may buy the asset in the next few months. By the moment, non-commercial traders have opened 35 thousand buy positions and 59 thousand sell positions. We do not expect long-lasting growth in the pound sterling. Although it has technical reasons for that, the fundamental and geopolitical factors do not presuppose a strong and fast increase.
Analysis of GBP/USD, 1-hour chart
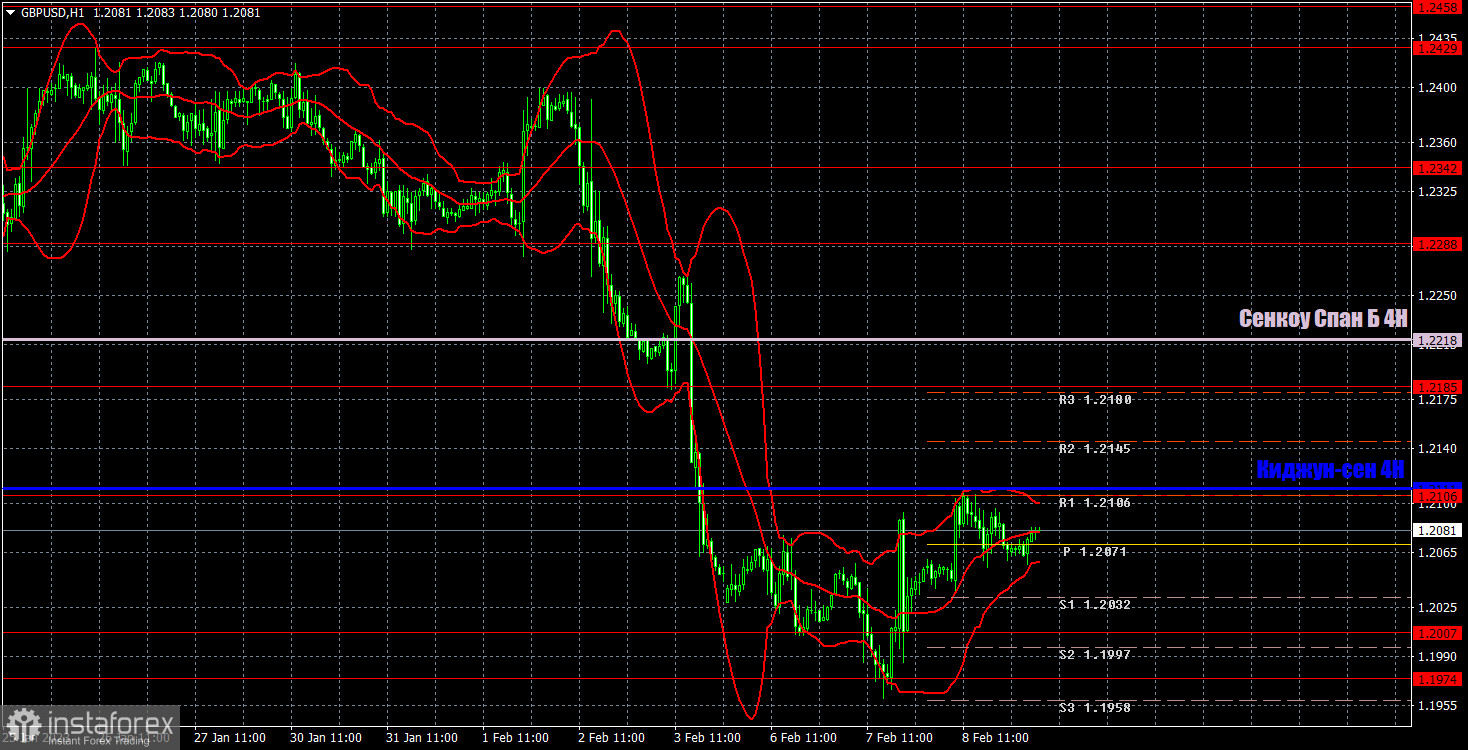
On the hourly chart, the pound/dollar pair is trying to rise, but all in vain. The price is located below the critical line, which is acting as strong resistance. Thus, bulls may fail to break it. The downward trend is likely to continue. However, before that, the price may trade sideways for some days. On February 9, there are the following important levels: 1.1760, 1.1874, 1.1974-1.2007, 1.2106, 1.2185, 1.2288, 1.2342. The Senkou Span B (1.2218) and Kijun-sen (1.2111) lines can give signals. Rebounds and breakouts of these levels could also act as signals. It is recommended to place the stop loss level at the breakeven when the price covers 20 pips in the right direction. The lines of the Ichimoku indicator could move during the day, which should be taken into account when determining trading signals. There are also support and resistance levels that could be used to fix profits. On Thursday, the UK and the US will hardly provide traders with important information. The US will disclose only its unemployment claims report, which may attract attention only if real data seriously contradicts forecasts.
What we see on the trading charts:
Price levels of support and resistance are thick red lines, near which the movement may end. They do not provide trading signals.
The Kijun-sen and Senkou Span B lines are the lines of the Ichimoku indicator, moved to the one-hour chart from the 4-hour one. They are strong lines.
Extreme levels are thin red lines from which the price bounced earlier. They provide trading signals.
Yellow lines are trend lines, trend channels, and any other technical patterns.
Indicator 1 on the COT charts reflects the net position size of each category of traders.
Indicator 2 on the COT charts reflects the net position size for the non-commercial group.
InstaForex analytical reviews will make you fully aware of market trends! Being an InstaForex client, you are provided with a large number of free services for efficient trading.


