 Stay
Stay 
Trading Conditions
Products
Tools


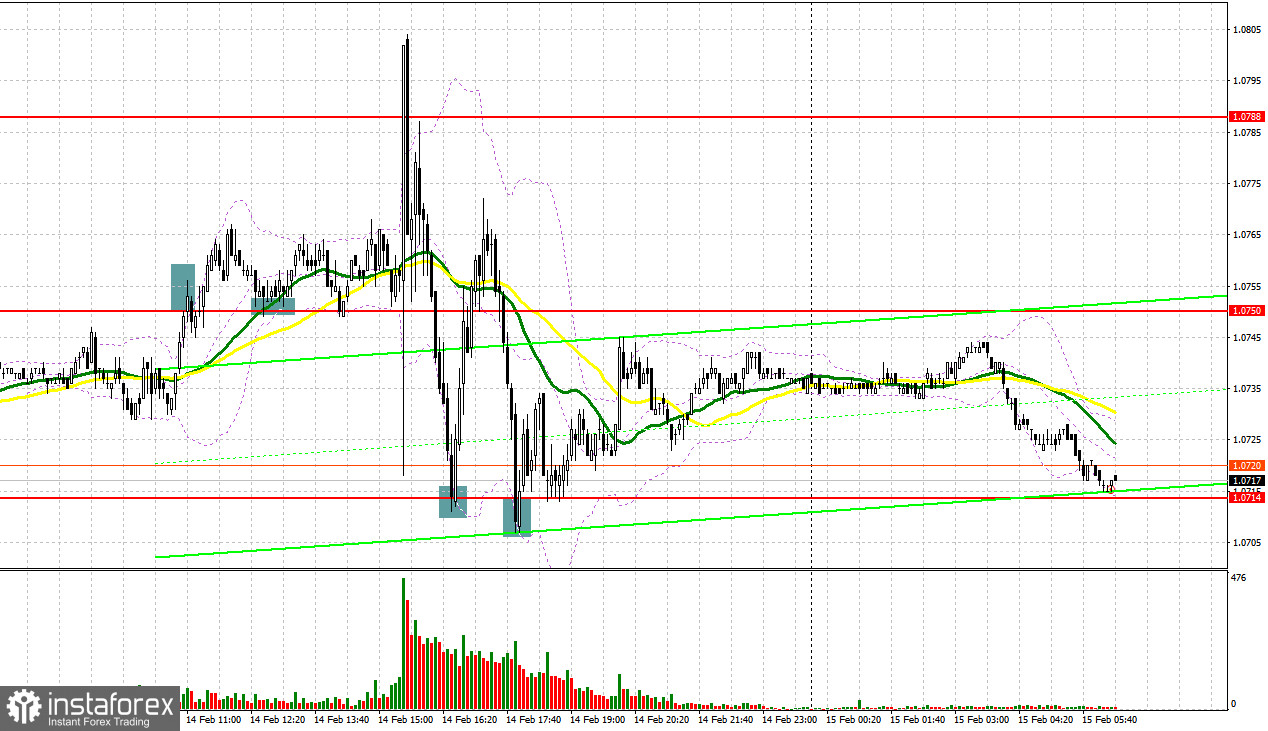
Yesterday, traders received several signals to enter the market. Let us take a look at the 5-minute chart to find out what happened. Earlier, I asked you to pay attention to the level of 1.0750 to decide when to enter the market. A jump in the first part of the day led to a false breakout of 1.0750. However, the pair did not fall, thus making investors suffer losses. In the second part of the day, before the publication of the US inflation figures, bulls managed to gain control over 1.0750. A downward test gave a buy signal, which allowed the pair to climb by 40 pips to touch the resistance level of 1.0788. After that, the euro dropped amid the news of still high inflation in the US. As a result, traders got several buy signals near 1.0714. Each of them led to a 50-pip income.
Conditions for opening long positions on EUR/USD:
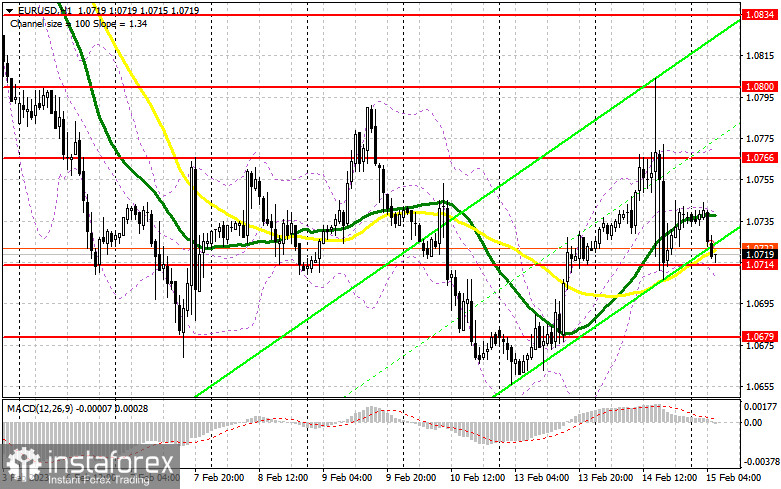
Yesterday, the eurozone disclosed its GDP data for the fourth quarter. The data was in line with the previous figures. In this light, all eyes were turned to the US inflation report. The indicator slid less than expected in January, which intensified traders' concerns about a further rise in the key interest rates. Today, the eurozone will disclose its industrial production figures and the trade balance data. However, comments that will be provided by Christine Lagarde are of greater importance. Only her announcements may boost the euro above 1.0714. If the euro/dollar pair drops in the first part of the day, traders will bet on this level and buyers' activity there. Only a false breakout of 1.0714 will give a buy signal with the target at the resistance level of 1.0766 formed yesterday. A breakout and a downward test of this area amid Christine Lagarde's hawkish comments will give an additional long signal with the target at 1.0800. However, the euro will hardly exceed this level until the publication of important fundamental data in the US. A breakout of 1.0800 will affect stop orders and give one more buy signal with the target at 1.0834, where traders should lock in profits. If the euro/dollar pair declines and buyers fail to protect 1.0714 in the first part of the day, pressure on the pair will remain the same. However, it does not mean that bulls will lose control over the market. Traders will focus on the support level of 1.0679. Slightly above this level, there are bullish MAs. Only a false breakout of this level will lead to a buy signal. Traders may also go long just after a bounce off the low of 1.0645 or even lower – at 1.0601, expecting a rise of 30-35 pips.
Conditions for opening short positions on EUR/USD:
Traders may go short from 1.0766, a resistance level formed yesterday. Before that, they should make sure that big traders are in the market. It is unlikely that bears will be aggressive ahead of the US retail sales report. Nevertheless, a false breakout of the level will be enough to launch a correction to 1.0714. A breakout and a reverse test of this level amid a dovish stance of the ECB's president will give an additional sell signal with the target at 1.0679, which will intensify the bearish sentiment. A settlement below this level will occur only amid confirmation that the US economy is still strong. In this case, the pair will tumble to 1.0645, where it is better to lock in profits. If the euro/dollar pair increases during the European session and bears fail to protect 1.0766, bulls will remain active. In the event of this, traders should avoid selling until the price touches 1.0800, where it is possible to sell only after an unsuccessful settlement. Traders may also go short just after a rebound from the high of 1.0834, expecting a decline of 30-35 pips.
COT report
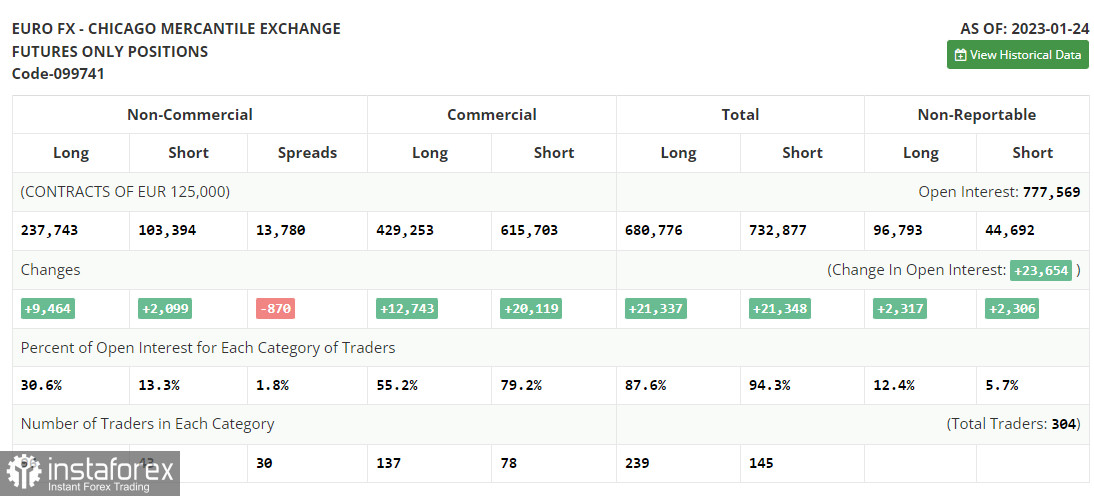
Since a technical problem in the CFTC has been settled yet. The latest COT report was published on January 24. Thus, the COT report for January 24 logged a rise in both short and long positions. Traders have significantly increased long positions following hawkish speeches of ECB policymakers. They are betting on further monetary tightening by the ECB and the Fed's dovish stance. The US regulator may reduce the pace of tightening for the second time in a row. Weak macro stats on the US economy, namely a drop in retail sales and a slowdown in inflation may force the central bank to take a pause in rate hikes to avoid any damage. This week, several central banks will hold their meetings. Their results will eventually determine the trajectory of the euro/dollar pair. According to the COT report, the number of long positions of the non-commercial group of traders increased by 9,464 to 237,743 while short positions advanced by 2,099 to 103,394. At the end of the week, the total non-commercial net position rose to 134,349 from 126,984. It appears investors believe in the upside potential of the euro. Nevertheless, they are waiting for more clues from central banks regarding interest rates. The weekly closing price grew to 1.0919 from 1.0833.
Signals of indicators:
Moving Averages
Trading is performed above 30- and 50-day moving averages, which points the balance in the market.
Note: The author considers the period and prices of moving averages on the one-hour chart which differs from the general definition of the classic daily moving averages on the daily chart.
Bollinger Bands
If the pair increases, the resistance level will be formed by the upper limit of the indicator located at 1.0750. In case of a decline, the lower limit of the indicator located at 1.0680 will act as support.
Description of indicators
InstaForex analytical reviews will make you fully aware of market trends! Being an InstaForex client, you are provided with a large number of free services for efficient trading.


