 Stay
Stay 
Trading Conditions
Products
Tools


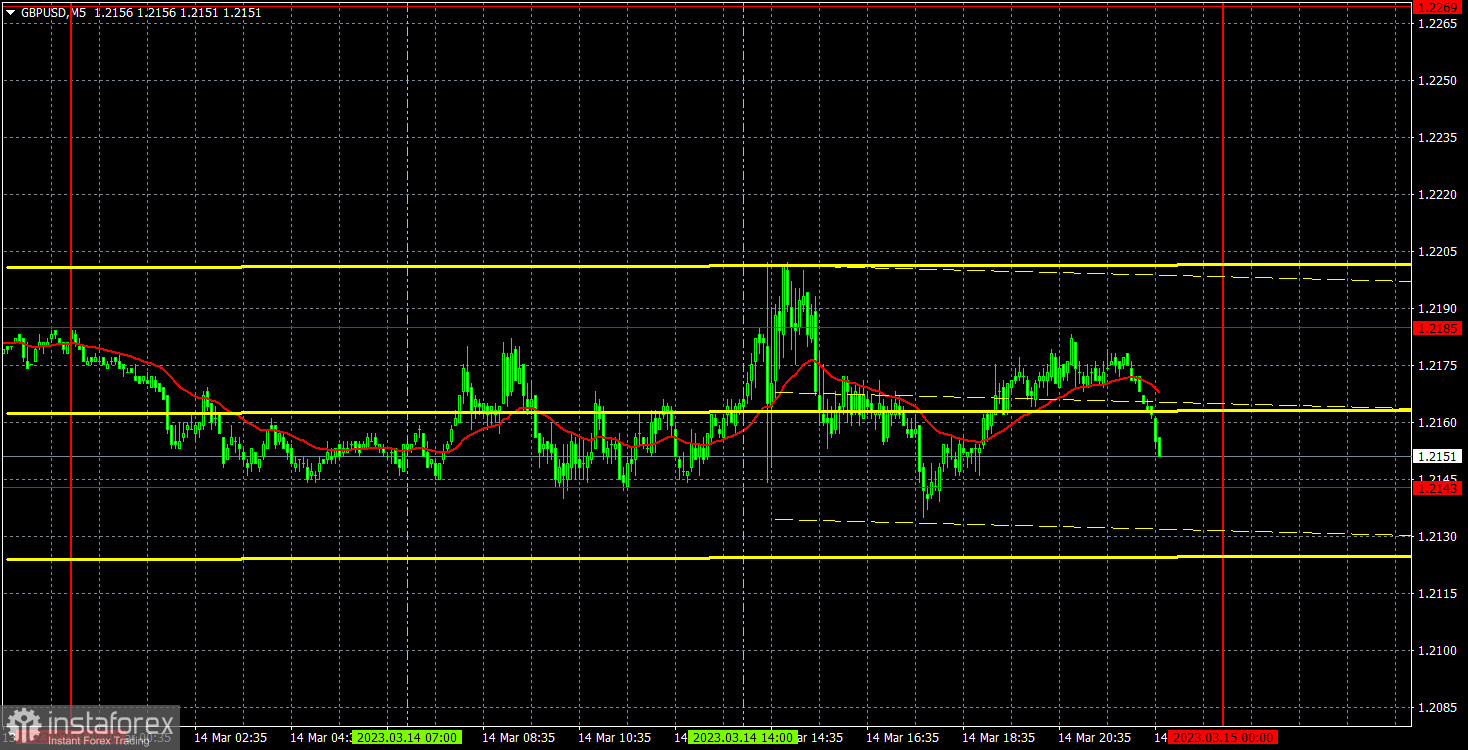
On Tuesday, GBP/USD traded in a narrow price range with low volatility even though there was macro data both in the UK and the US. Moreover, the US even released an inflation report, which is usually considered important. However, the market was so tired of buying the pair for the last three days that it just took a break yesterday. Sure, there was a burst of activity at the time of the inflation report, but it was short-lived. Generally, we still see no reasons for the pound's sharp growth. Moreover, the pair could not start a correction after rising to 2100 points. The fundamental background for the USD worsened during the last week, but it is not a reason for the pound to sharply rise.
There is not much to say about Tuesday's trading signals. The pair spent the whole day between 1.2143 and 1.2185 and during the release of the US inflation report, it tried to leave this horizontal channel. It failed. And so, traders could only trade using the bounce from both levels, but they are very close to each other, so each position could take 10-15 pips at best. There is no sense in analyzing each trade taken separately, they were all almost the same, but there were enough signals, which could bring profit.
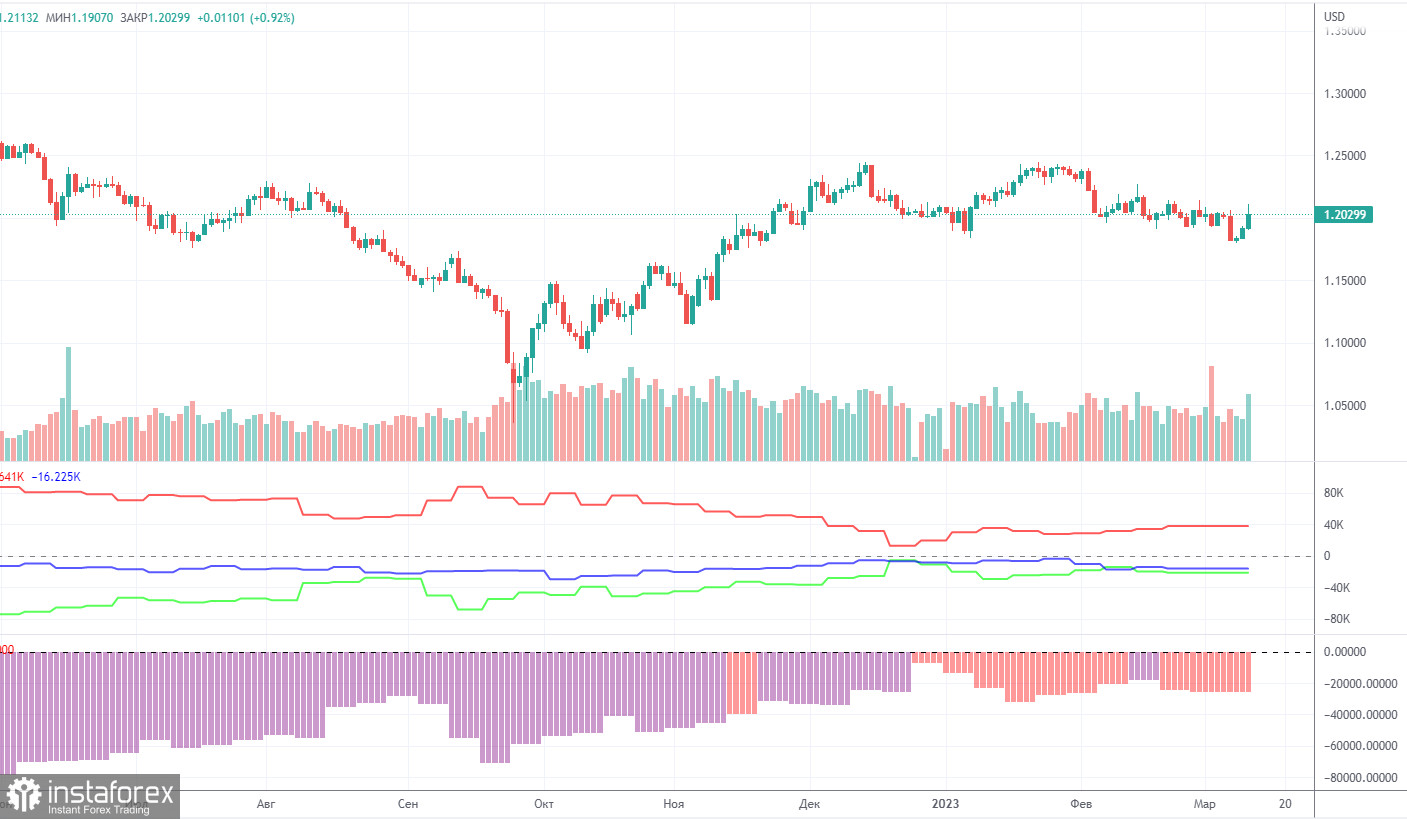
The latest COT report on GBP/USD dates back to February 21. Naturally, these reports are of little use now, but it's still better than nothing at all. According to the latest data, non-commercial traders opened 3,300 long positions and 4,900 short ones. The net position fell by 1,600. The net non-commercial position has been bullish in recent months although sentiment remains bearish. The pound has been on the rise against the greenback for some unknown reason. We should not rule out the possibility of a strong decline in price in the near term. Technically, it has already started to decline although it seems to be a flat trend. In fact, the movement of GBP/USD is now akin to that of EUR/USD. At the same time, the net position on EUR/USD is positive, signaling the upcoming end of the bullish momentum. Meanwhile, the net position on GBP/USD is negative. Non-commercial traders now hold 67,000 sell positions and 46,000 long positions. There is still a gap. We are still skeptical that the pair will be bullish in the long term and expect a steep drop.
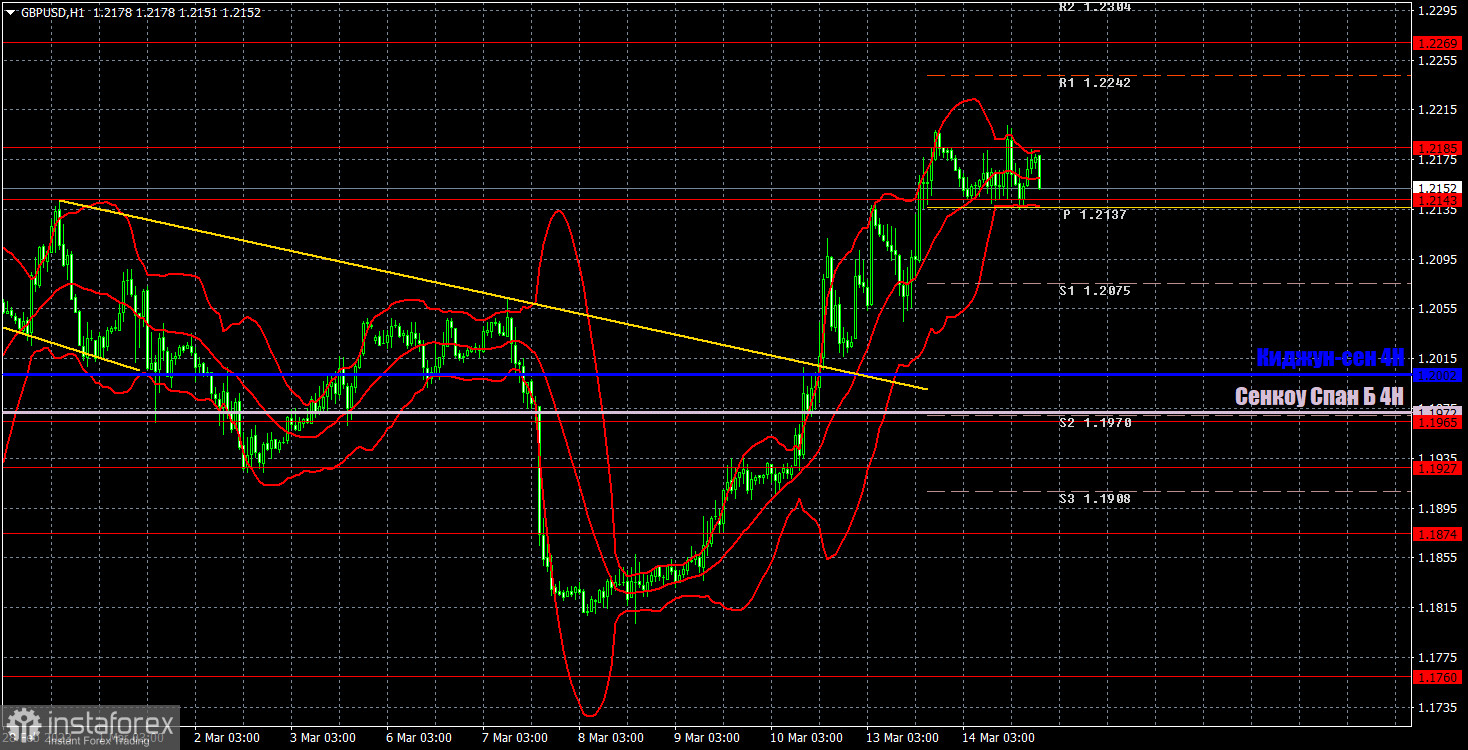
On the one-hour chart, GBP/USD has overcome another short-term trend line, which only confirms my assumptions about the "swing". Formally, the pair might continue rising for some time, but all the factors for further growth should have already been worked off by the market. Swings persist, so the pair could fall this week. The pair has already tried to surpass 1.2185 twice, but failed each time, which gives hope for a bearish correction at least.
On March 15, it is recommended to trade at the key level of 1.1760, 1.1874, 1.1927, 1.1965, 1.2143, 1.2185, 1.2269, 1.2342, 1.2429. The Senkou Span B (1.1972) and Kijun Sen (1.2002) lines can also generate signals. Rebounds and breakouts from these lines can also serve as trading signals. It is better to set the Stop Loss at breakeven as soon as the price moves by 20 pips in the right direction. The lines of the Ichimoku indicator can change their position throughout the day which is worth keeping in mind when looking for trading signals. On the chart, you can also see support and resistance levels where you can take profit. On Wednesday, there are no important events or reports planned for Great Britain. There are only minor reports in the US. I believe that today is a good time to start a bearish correction, but overcoming 1.2185 may open the way to new heights. But I repeat, I don't think it is a logical and reasonable development.
Resistance/support - thick red lines, near which the trend may stop. They do not make trading signals.
Kijun-sen and Senkou Span B are the Ichimoku indicator lines moved to the hourly timeframe from the 4-hour timeframe. They are also strong lines.
Extreme levels are thin red lines, from which the price used to bounce earlier. They can produce trading signals.
Yellow lines are trend lines, trend channels, and any other technical patterns.
Indicator 1 on the COT chart is the size of the net position of each trader category.
Indicator 2 on the COT chart is the size of the net position for the Non-commercial group of traders.
InstaForex analytical reviews will make you fully aware of market trends! Being an InstaForex client, you are provided with a large number of free services for efficient trading.


