 Stay
Stay 
Trading Conditions
Products
Tools


On Thursday, GBP/USD also tried to continue the bullish correction and is generally moving very similar to EUR/USD. The collapse on Wednesday could also be caused by the problems at Credit Suisse Bank in Switzerland. But anyway it has been flat and "swinging" for some weeks or months now. That's why constant changes of direction shouldn't surprise anyone. Trading in such conditions is really difficult, at least on the higher charts. But we have certain levels and intraday trends on lower charts. However, even that doesn't always help. If the movement is turbulent with frequent reversals, not even one level can save us from losing trades. There were no important events in the UK. And it was also just some minor data in the US, which, even if influenced by the market mood, was difficult to detect, because the pair was swinging up and down all day. It is the last day of the trading week and something tells us that the nature of the movement will not improve.
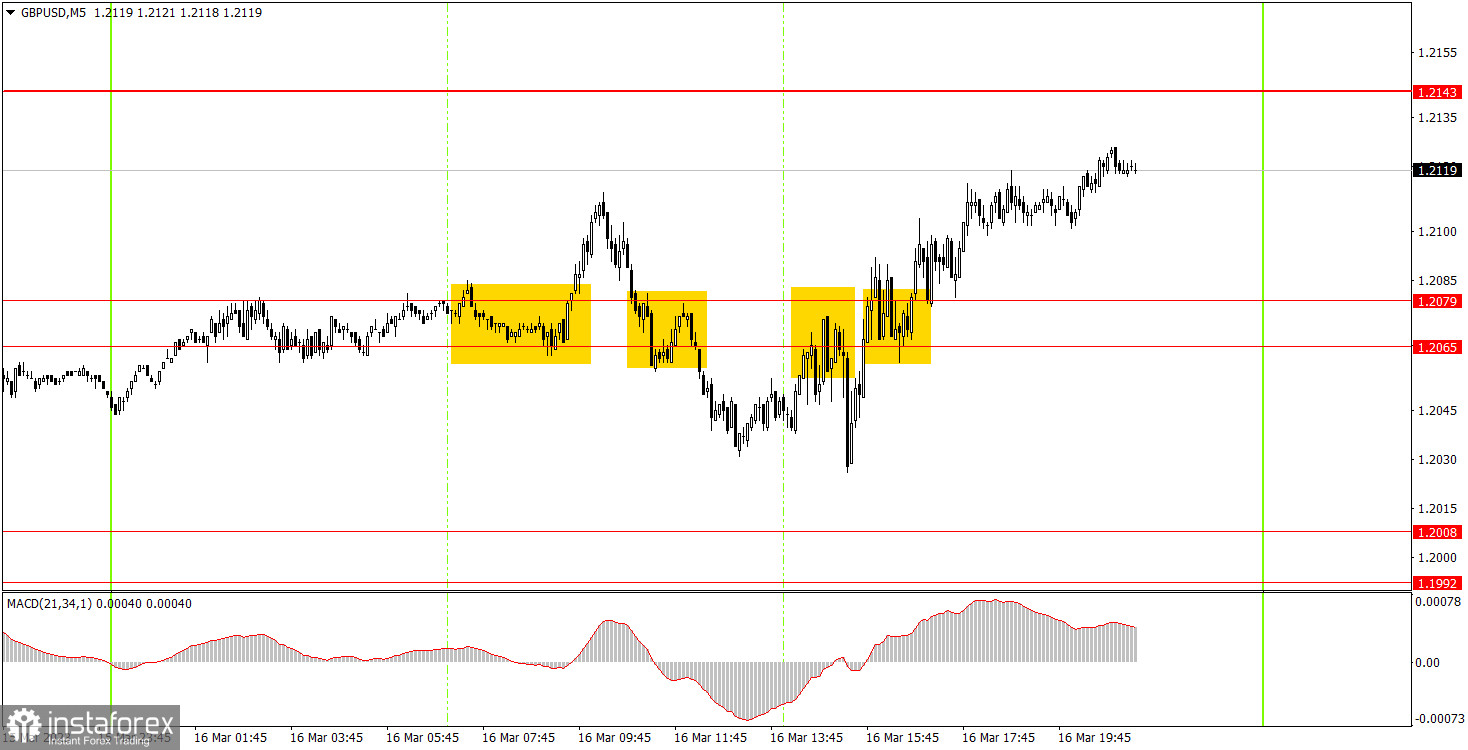
Speaking of trading signals, everything wasn't easy. All the signals were formed in the area of 1.2065-1.2079 and all of them were false. Therefore, it was possible to work out only the first two. The price has never reached the target level. In the first case, the pair went up about 20 points, so beginners could place the Stop Loss on Breakeven. It was the same thing for the second case. By the end of the day, there was neither profit nor loss. So remember that the movements are very turbulent now, so any deals involve increased risks.
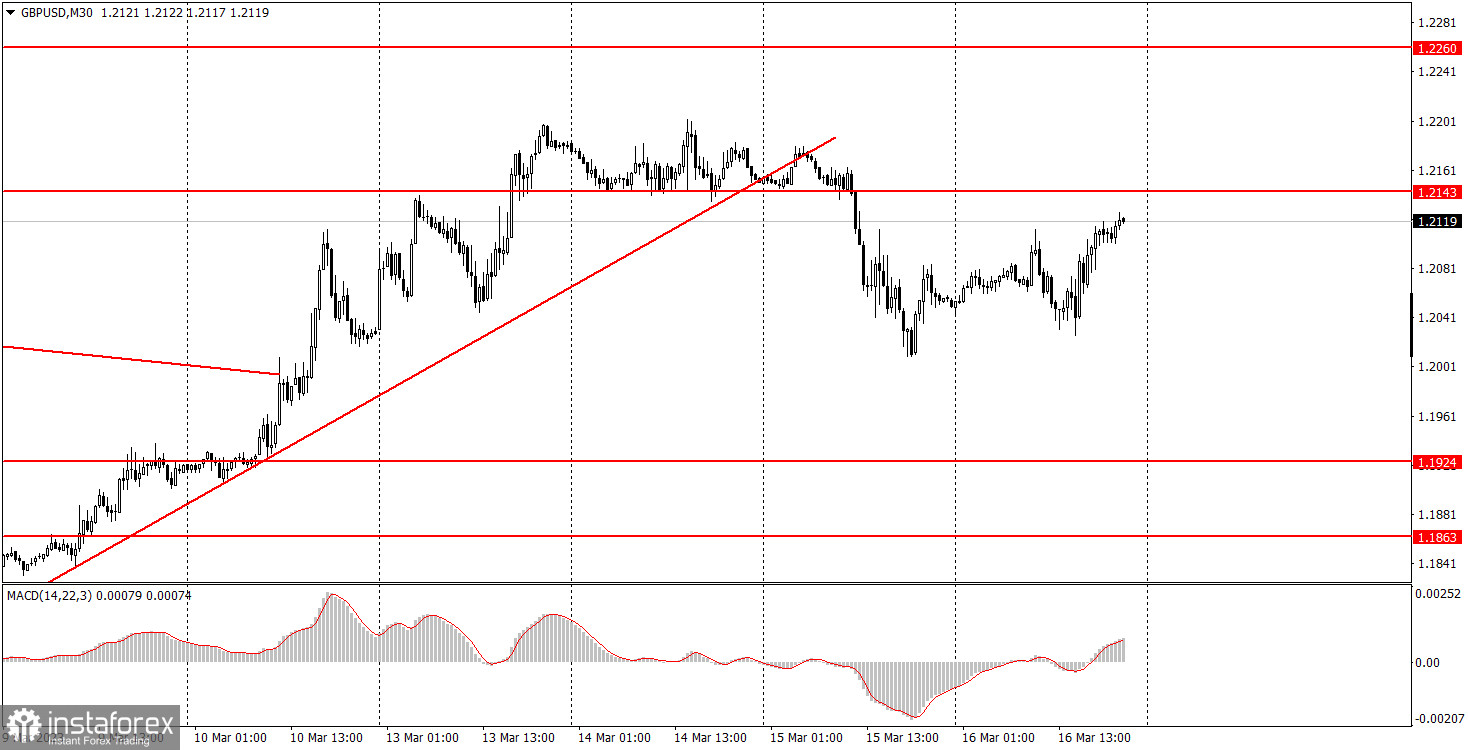
On the 30-minute chart, GBP/USD finished another short-term uptrend, so it may resume falling in the coming days. Meetings of the Federal Reserve and the Bank of England will be held next week, so nothing should prevent the pound from falling on Friday, but we see that the movements are absolutely unpredictable. On the 5-minute chart, it is recommended to trade at the levels 1.1793, 1.1863-1.1877, 1.1924, 1.1992-1.2008, 1.2065-1.2079, 1.2143, 1.2171-1.2179, 1.2245-1.2260, 1.2337-1.2343 and 1.2387. As soon as the price passes 20 pips in the right direction, you should set a Stop Loss to breakeven. On Friday, no interesting reports are scheduled for the UK, while the US will release minor reports like industrial production and the consumer sentiment index from the University of Michigan. Thus, unless there is news that is as huge as another bank collapse, we do not expect a trend movement. But ironically, it's quite possible, because that's what the confusion is all about.
1) The strength of the signal is determined by the time it took the signal to form (a rebound or a breakout of the level). The quicker it is formed, the stronger the signal is.
2) If two or more positions were opened near a certain level based on a false signal (which did not trigger a Take Profit or test the nearest target level), then all subsequent signals at this level should be ignored.
3) When trading flat, a pair can form multiple false signals or not form them at all. In any case, it is better to stop trading at the first sign of a flat movement.
4) Trades should be opened in the period between the start of the European session and the middle of the US trading hours when all positions must be closed manually.
5) You can trade using signals from the MACD indicator on the 30-minute time frame only amid strong volatility and a clear trend that should be confirmed by a trendline or a trend channel.
6) If two levels are located too close to each other (from 5 to 15 pips), they should be considered support and resistance levels.
Support and Resistance levels are the levels that serve as targets when buying or selling the pair. You can place Take Profit near these levels.
Red lines are channels or trend lines that display the current trend and show in which direction it is better to trade now.
The MACD indicator (14, 22, and 3) consists of a histogram and a signal line. When they cross, this is a signal to enter the market. It is recommended to use this indicator in combination with trend patterns (channels and trendlines).
Important announcements and economic reports that can be found on the economic calendar can seriously influence the trajectory of a currency pair. Therefore, at the time of their release, we recommend trading as carefully as possible or exiting the market in order to avoid sharp price fluctuations.
Beginners on Forex should remember that not every single trade has to be profitable. The development of a clear strategy and money management is the key to success in trading over a long period of time.
InstaForex analytical reviews will make you fully aware of market trends! Being an InstaForex client, you are provided with a large number of free services for efficient trading.


