 Stay
Stay 
Trading Conditions
Products
Tools


On Monday, EUR/USD gradually traded higher. We have already questioned the validity of the euro's current growth, but let me remind you that there are "swings" on the higher charts. And in the "swing" mode, the pair can move unreasonably, completely ignoring the fundamental and macroeconomic background. By the way, European Central Bank President Christine Lagarde delivered two speeches in the European Parliament. She stated that high inflation will persist for a long time, which hints at the ECB's unwillingness to fight it by any means and at any cost. From our point of view, such words are a bearish factor for the euro, but, as we can see, it managed to grow for the third straight day. Perhaps the bulls were supported by the news about Credit Suisse's merger with UBS, but in this case, it would be logical if the pair's growth had started overnight. In general, it is difficult to say why the euro grew on Monday. Or impossible, because there were no reasons.

On the 5-minute chart, it is clear that the movement was not the best, but it wasn't the worst either. During the day, there was only one trading signal - a breakthrough of 1.0692. Beginners could price it because it was quite strong and unambiguous. It was possible to gain about 15-20 pips on the long position, and it should have been closed manually closer to the evening, since the pair did not reach the target level of 1.0737. The profit is small, but better such a profit than a loss.
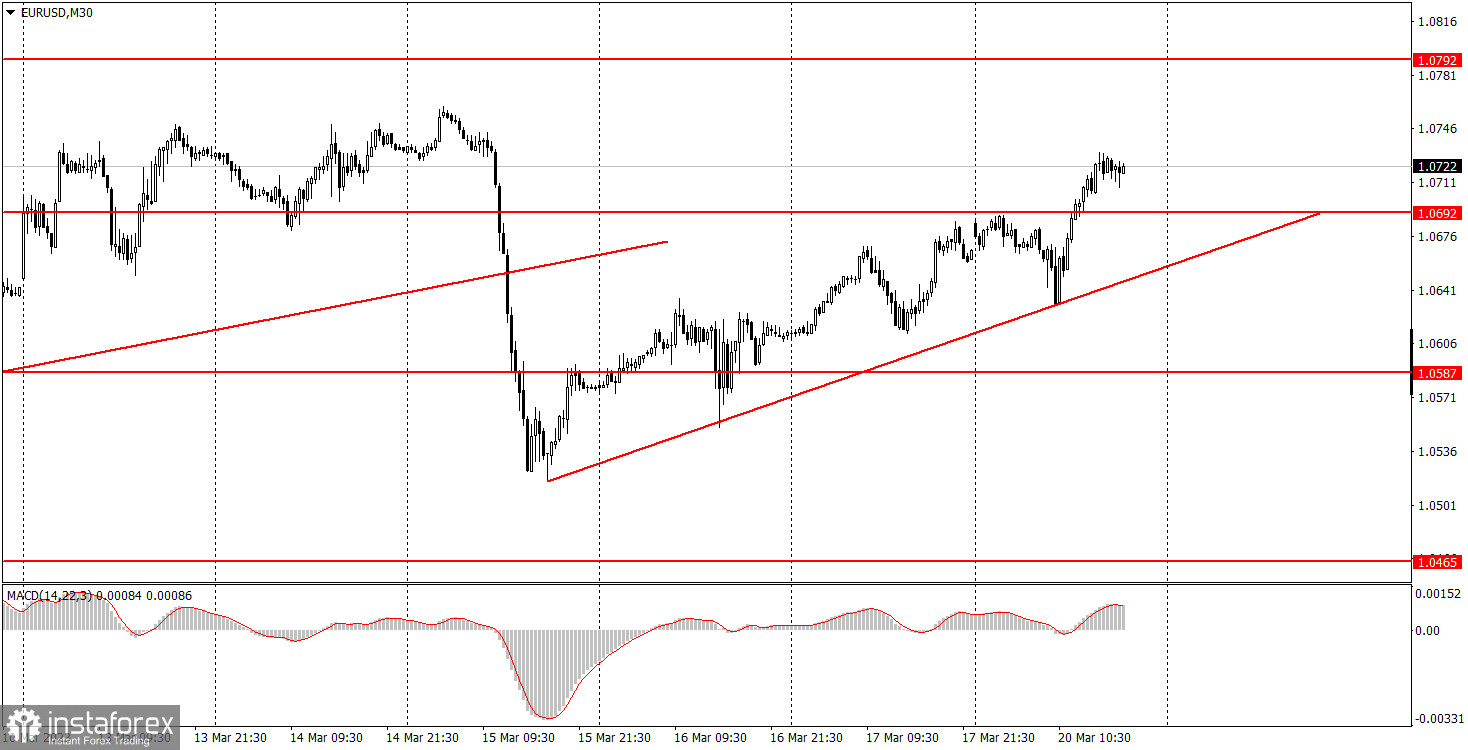
On the 30-minute chart, the pair quickly finished forming an uptrend, rolled back down and started a new one, as evidenced by the ascending trend line. Don't forget that the pair can move in any direction, not depending on macroeconomic background, trend lines and "fundamentals". Also, consolidating below the trend line does not mean that a strong bearish movement will start. On the 5-minute chart, it is recommended to trade at the levels 1.0433, 1.0465-1.0483, 1.0535, 1.0587-1.0607, 1.0692, 1.0737, 1.0792, 1.0857-1.0867. As soon as the price passes 15 pips in the right direction, you should set a Stop Loss to breakeven. Lagarde will give another speech in the European Union. Obviously, again in the European Parliament, but in front of another committee. Thus, the key points may remain the same, which means we should not expect any reaction. In fact, there was none on Monday, which makes Tuesday all the more so. Nothing interesting will happen in America again.
1) The strength of the signal is determined by the time it took the signal to form (a rebound or a breakout of the level). The quicker it is formed, the stronger the signal is.
2) If two or more positions were opened near a certain level based on a false signal (which did not trigger a Take Profit or test the nearest target level), then all subsequent signals at this level should be ignored.
3) When trading flat, a pair can form multiple false signals or not form them at all. In any case, it is better to stop trading at the first sign of a flat movement.
4) Trades should be opened in the period between the start of the European session and the middle of the US trading hours when all positions must be closed manually.
5) You can trade using signals from the MACD indicator on the 30-minute time frame only amid strong volatility and a clear trend that should be confirmed by a trendline or a trend channel.
6) If two levels are located too close to each other (from 5 to 15 pips), they should be considered support and resistance levels.
Support and Resistance levels are the levels that serve as targets when buying or selling the pair. You can place Take Profit near these levels.
Red lines are channels or trend lines that display the current trend and show in which direction it is better to trade now.
The MACD indicator (14, 22, and 3) consists of a histogram and a signal line. When they cross, this is a signal to enter the market. It is recommended to use this indicator in combination with trend patterns (channels and trendlines).
Important announcements and economic reports that can be found on the economic calendar can seriously influence the trajectory of a currency pair. Therefore, at the time of their release, we recommend trading as carefully as possible or exiting the market in order to avoid sharp price fluctuations.
Beginners on Forex should remember that not every single trade has to be profitable. The development of a clear strategy and money management is the key to success in trading over a long period of time.
InstaForex analytical reviews will make you fully aware of market trends! Being an InstaForex client, you are provided with a large number of free services for efficient trading.


