 Stay
Stay 
Trading Conditions
Products
Tools


The Office for National Statistics report showed UK retail sales jumped by 1.2%, while economists had expected growth of only 0.2%. In annual terms, there is a slowdown in the decline from -5.4% to -3.5%.
Particular attention was paid to the preliminary assessment of business activity indices in Europe, the United Kingdom, and the United States.
Details of PMI statistics:
Eurozone Manufacturing PMI fell to 47.1 in March from previous month's 48.5, against the forecast of 49.4. Services PMI rose to 55.6 from 52.7, against the forecast of 52.5. While composite PMI rose to 54.1 from 52.0, with an estimated decline to 51.9 points.
UK Manufacturing PMI fell to 48.0 from 49.3, against the forecast of 50.0. Services PMI fell to 52.8 from 53.5. While composite PMI rose to 52.2 from 53.1.
U.S. Manufacturing PMI rose from 47.3 to 49.3. Services PMI rose from 50.6 to 53.8. While Composite PMI rose from 50.6 to 53.8.
Due to the divergence of expectations regarding statistical data for the United States, the dollar received support from buyers in the market.

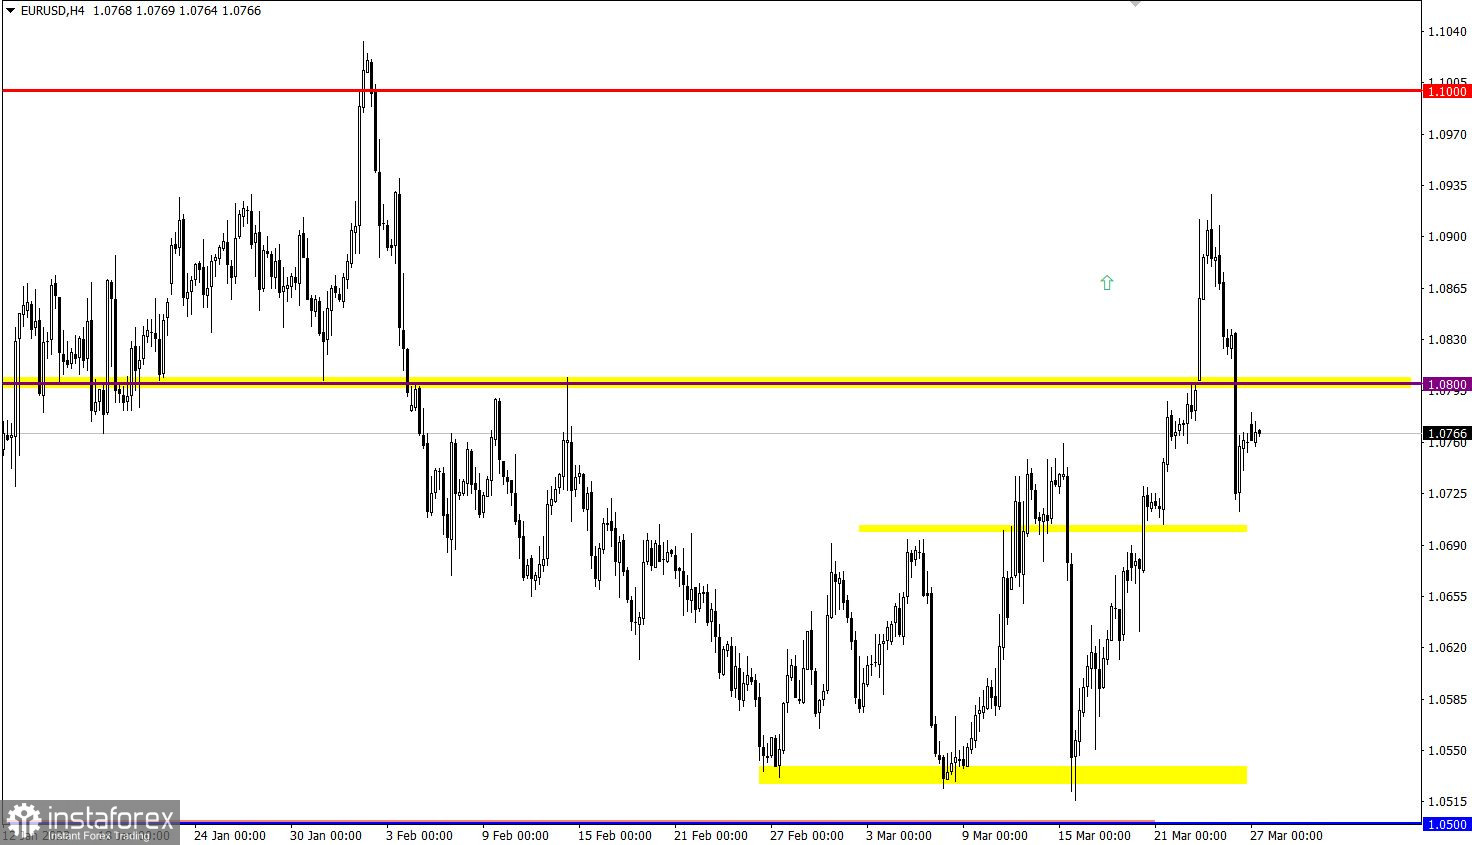
EUR/USD entered a correction phase after a significant strengthening last week. The level of 1.0930 became a significant resistance for buyers, causing an increase in the volume of short positions.
During a correction phase from 1.2300, GB/USD reached the value of 1.2200, where there was a reduction in the volume of short positions.
The economic calendar is traditionally empty on Monday. No important reports are expected in the Eropean Union, the United Kingdom, and the Unites States.
In this regard, investors and traders intend to focus on the incoming information and news flow. Hot topics: inflation, interest rates, problems in the U.S. and the EU banking sector.
If we consider the current correction, its scale has likely already reached its limit. In this case, we can expect a gradual recovery of the euro at least above the 1.0800 level. However, if market participants maintain a downward mood and quotes remain below 1.0700, this may lead to a change in trading interests and a transition from a corrective phase to a new stage of decline.
Failure to hold below 1.2200 would result in a reversal, allowing for a full recovery of the pound's value from the recent correction. If the value of 1.2200 does not stand up to sellers, quotes may decline to the 1.2150 support level.
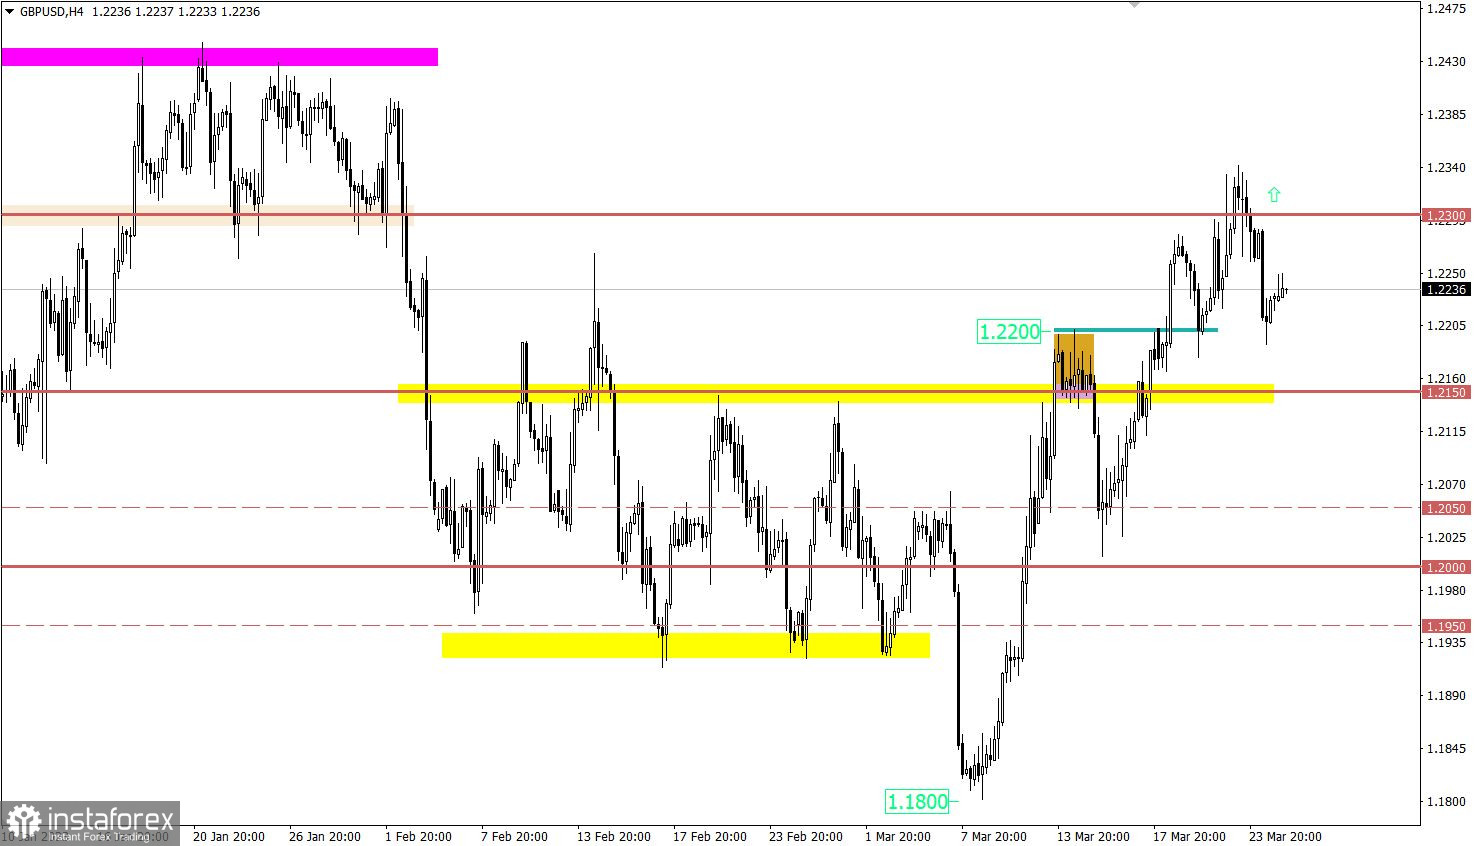
The candlestick chart type is white and black graphic rectangles with lines above and below. With a detailed analysis of each individual candle, you can see its characteristics relative to a particular time frame: opening price, closing price, intraday high and low.
Horizontal levels are price coordinates, relative to which a price may stop or reverse its trajectory. In the market, these levels are called support and resistance.
Circles and rectangles are highlighted examples where the price reversed in history. This color highlighting indicates horizontal lines that may put pressure on the asset's price in the future.
The up/down arrows are landmarks of the possible price direction in the future.
InstaForex analytical reviews will make you fully aware of market trends! Being an InstaForex client, you are provided with a large number of free services for efficient trading.


