 Stay
Stay 
Trading Conditions
Products
Tools


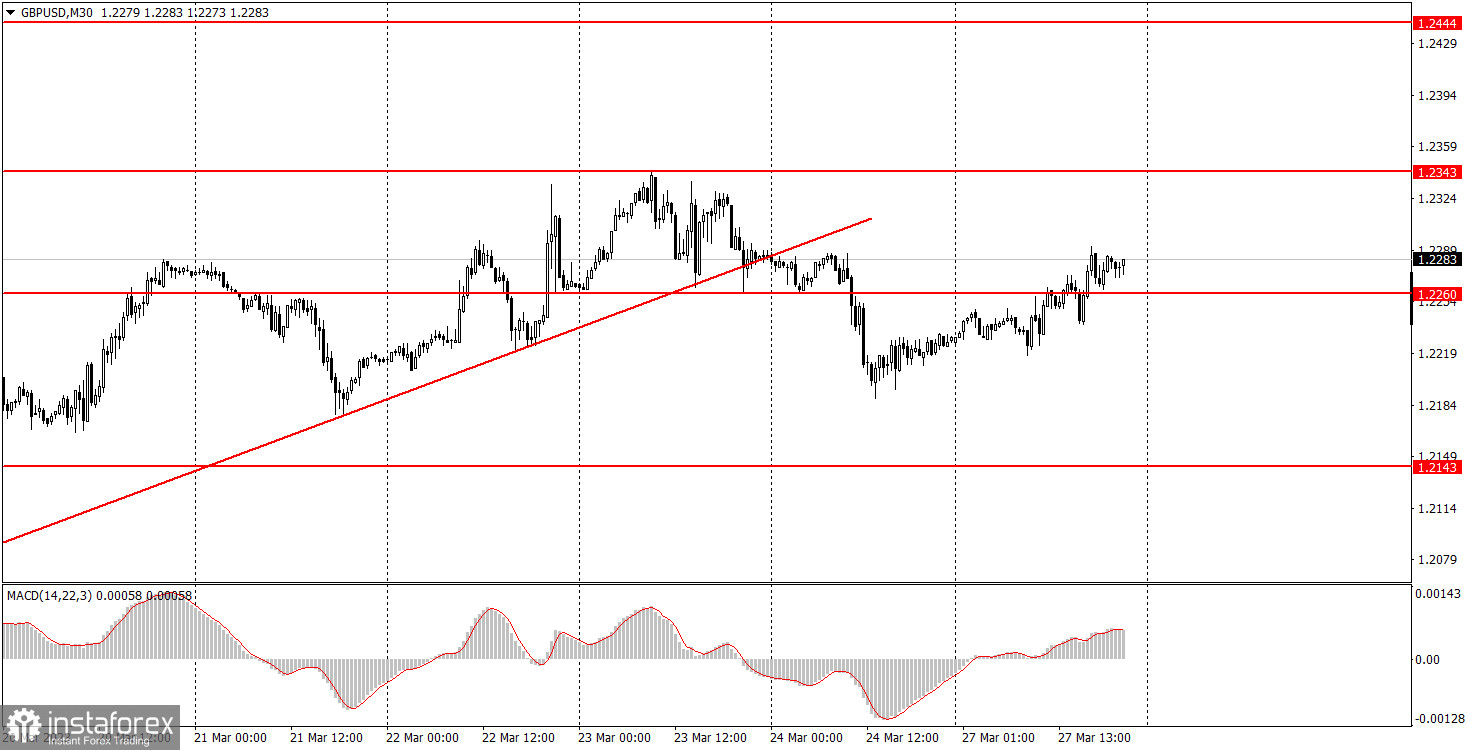
GBP/USD also corrected on Monday after Friday's fall and after breaking through the ascending trend line. Volatility was low - only about 75 pips. Bank of England Governor Andrew Bailey spoke during the day, but judging by the pair's movement, it is clear that Bailey did not say anything important for the market. His rhetoric was probably neutral again. So the market had nothing to react to. Therefore, the movement was sluggish. After consolidating below the trend line, I expect the pound to fall further. In addition, I believe that it has risen too much recently, which did not correspond to the fundamental background. However, on the 24-hour view, the pair still moves within the horizontal channel of 1.2840-1.2440, so the pound may continue to grow solely on technical grounds. Bailey will deliver another speech on Tuesday, but it will probably be similar to his Monday speech.
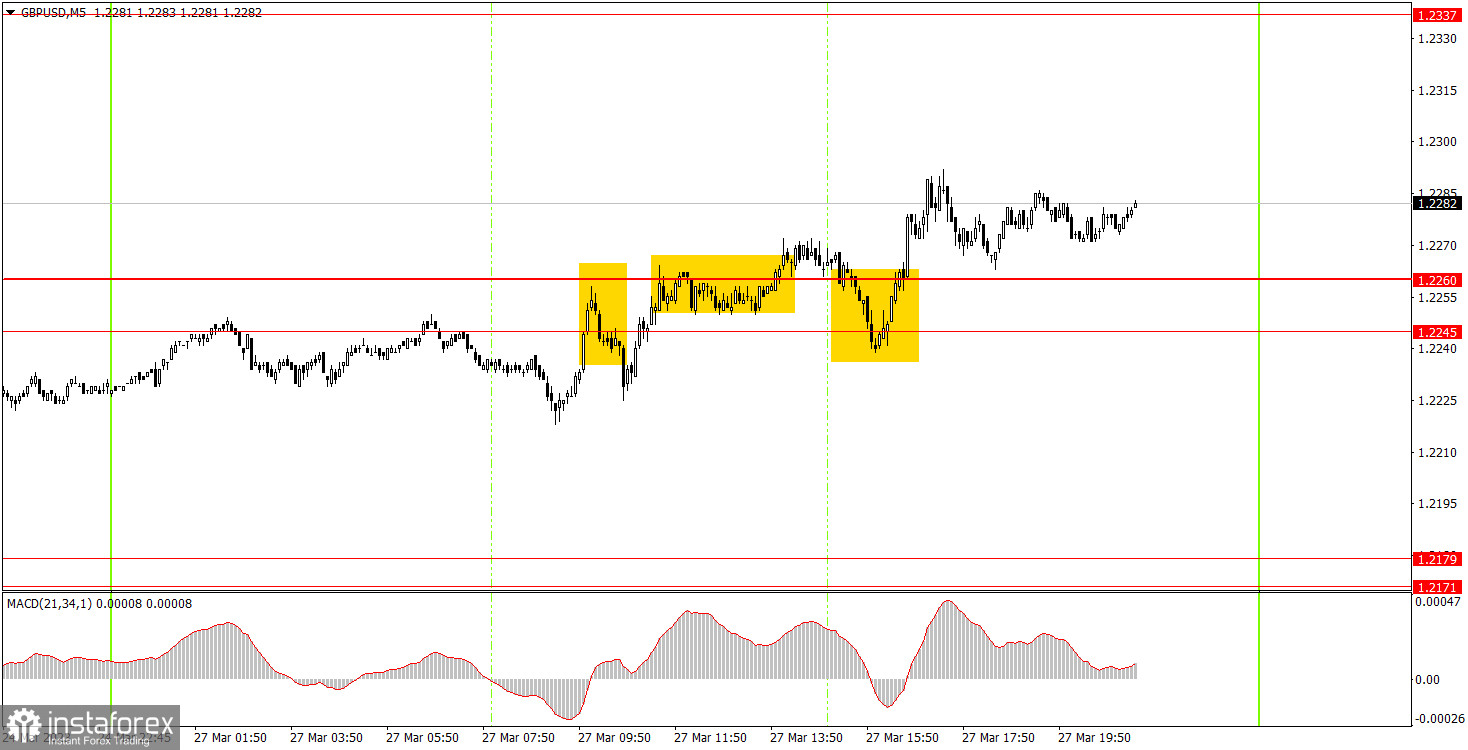
It is better not to talk about trading signals because it will just spoil the mood. If it was possible to avoid the false signals on the euro since the movement was almost flat, then this wasn't the case for the pound. At first the pair rebounded from the 1.2245-1.2260 area, then it overcame it, and then rebounded from above it. Each signal was terribly inaccurate, and the pair did not pass 20 points in the right direction even once. Thus, beginners could try to test only the first two signals, both of which resulted in 20-25 pips loss. It wasn't a good day, but then again every day can't be profitable anyway. It was difficult to count on profit amid such movement.
On the 30-minute chart, GBP/USD continues to trade in the classic "swing", but in the long term. After several weeks of growth, we have long been waiting for the pair to enter a bearish correction. So far, the correction has been weak, but I expect the pound to fall further. On the 5-minute chart, it is recommended to trade at the levels 1.1924, 1.1992-1.2008, 1.2065-1.2079, 1.2143, 1.2171-1.2179, 1.2245-1.2260, 1.2337-1.2343, 1.2387, 1.2444-1.2471. As soon as the price passes 20 pips in the right direction, you should set a Stop Loss to breakeven. Bailey is set to give another speech on Tuesday in the UK. However, if it will be the same as it was on Monday (and that's probably the case), then we should not expect any market reaction. There is nothing interesting planned in the US. So we are in for another boring day.
1) The strength of the signal is determined by the time it took the signal to form (a rebound or a breakout of the level). The quicker it is formed, the stronger the signal is.
2) If two or more positions were opened near a certain level based on a false signal (which did not trigger a Take Profit or test the nearest target level), then all subsequent signals at this level should be ignored.
3) When trading flat, a pair can form multiple false signals or not form them at all. In any case, it is better to stop trading at the first sign of a flat movement.
4) Trades should be opened in the period between the start of the European session and the middle of the US trading hours when all positions must be closed manually.
5) You can trade using signals from the MACD indicator on the 30-minute time frame only amid strong volatility and a clear trend that should be confirmed by a trendline or a trend channel.
6) If two levels are located too close to each other (from 5 to 15 pips), they should be considered support and resistance levels.
Support and Resistance levels are the levels that serve as targets when buying or selling the pair. You can place Take Profit near these levels.
Red lines are channels or trend lines that display the current trend and show in which direction it is better to trade now.
The MACD indicator (14, 22, and 3) consists of a histogram and a signal line. When they cross, this is a signal to enter the market. It is recommended to use this indicator in combination with trend patterns (channels and trendlines).
Important announcements and economic reports that can be found on the economic calendar can seriously influence the trajectory of a currency pair. Therefore, at the time of their release, we recommend trading as carefully as possible or exiting the market in order to avoid sharp price fluctuations.
Beginners on Forex should remember that not every single trade has to be profitable. The development of a clear strategy and money management is the key to success in trading over a long period of time.
InstaForex analytical reviews will make you fully aware of market trends! Being an InstaForex client, you are provided with a large number of free services for efficient trading.


