 Stay
Stay 
Trading Conditions
Products
Tools


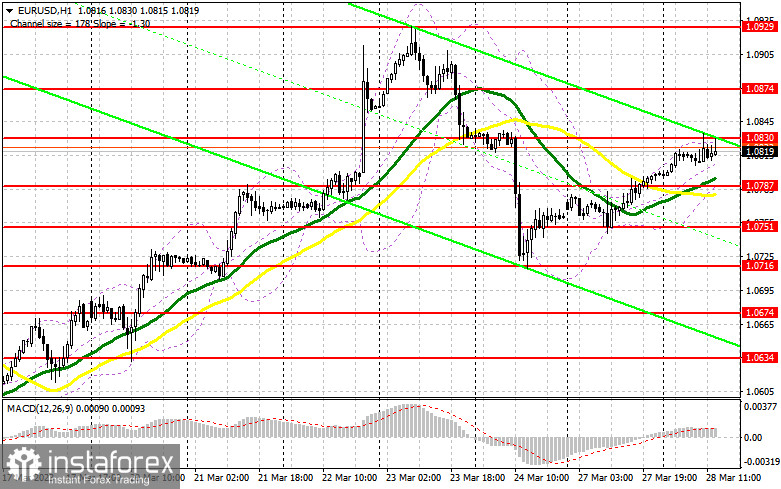
In the previous review, we considered entering the market near the 1.0830 mark. Let's analyze the M5 chart. A signal to sell the instrument came after growth and a false breakout through the level. The price dropped by 20 pips but failed to extend the downtrend. The trading plan for the North American session has not changed.

When to open long positions on EURUSD:
In the wake of an empty macroeconomic calendar in the eurozone and ECB policymakers' speeches, the bulls attempted to push EUR/USD above 1.0830. Yet, no breakout happened. In the North American session, data on US consumer confidence will be delivered. This report could affect the price intraday. If it comes better than expected, the instrument will face pressure and go down to the nearest support level of 1.0787, which is in line with the bullish moving averages. After a false breakout, we may buy, targeting the nearest resistance level of 1.0830. In fact, the pair has not broken above it yet. In case of a disappointing US consumer activity report, the price is likely to reach 1.0874 after a breakout and a downside test of this range, targeting a monthly high of 1.0929. The most distant target is seen at the 1.0964 high, where I am going to lock in profits. If EUR/USD goes down in the North American session with the absence of bullish activity at 1.0787, the pressure on the instrument will mount. After a false breakout near 1.0751 support, we may buy EUR/USD. We may also buy after a bounce off 1.0716 or 1.0674, allowing a correction of 30-35 pips intraday.
When to open short positions on EURUSD:
We may see a short-term downtrend continuation for as long as the pair trades below 1.0830. In the North American session, the bears need to protect resistance at 1.0830. A false breakout through the mark will create a sell entry point with the target near 1.0787 support. Meanwhile, a breakout and a retest of this range will drive the pair to the 1.0751 level. After consolidation below this range on the back of positive consumer confidence data in the US, the price may plummet to 1.0716, which will indicate a strong bearish bias. I am going to lock in profit at this level. If GBP/USD goes up and there is no bullish activity at 1.0830 in the North American session, we may sell at 1.0874 after a false breakout. Likewise, we may sell after a bounce of the 1.0929 high, allowing a bearish correction of 30-35 pips.
Commitments of Trader
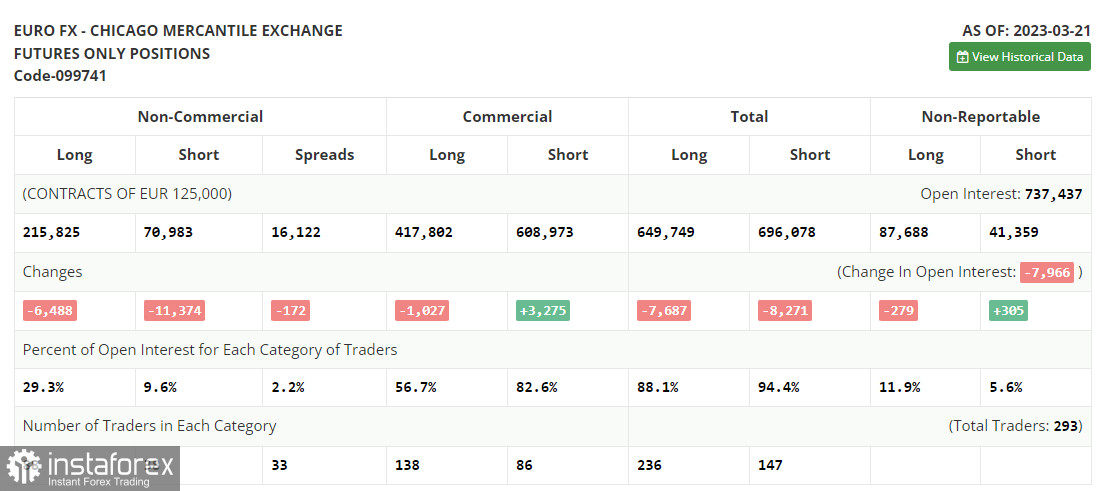
According to the COT report from March 21, the number of both long and short positions decreased. The situation in the market changed after the Fed's March meeting. The regulator maintained its monetary policy. So, the US dollar is unlikely to fall steeply. The euro is currently receiving support from the aggressive ECB only. The central bank is planning to remain hawkish. The COT logged a decrease in long non-commercial positions by 6,488 to 215,825. The number of short non-commercial positions fell by 11,374 to 70,983. As a result, the total non-commercial net position increased to 144,842 against 139,956. The weekly closing price rose to 1.0821 against 1.0803.
Indicator signals:
Moving averages
Trading is carried out above the 30-day and 50-day moving averages, showing the attempts of the bulls to return to the market.
Note: The period and prices of moving averages are viewed by the author on the hourly chart and differ from the general definition of classic daily moving averages on the daily chart.
Bollinger Bands
Resistance is seen at 1.0830, in line with the upper band.
Indicator description:
Moving average (MA) determines the current trend by smoothing volatility and noise. Period 50. Colored yellow on the chart.
Moving average (MA) determines the current trend by smoothing volatility and noise. Period 30. Colored green on the chart.
Moving Average Convergence/Divergence (MACD). Fast EMA 12. Slow EMA 26. SMA 9.
Bollinger Bands. Period 20
Non-commercial traders are speculators such as individual traders, hedge funds, and large institutions who use the futures market for speculative purposes and meet certain requirements.
Long non-commercial positions are the total long position of non-commercial traders.
Non-commercial short positions are the total short position of non-commercial traders.
Total non-commercial net position is the difference between the short and long positions of non-commercial traders.
InstaForex analytical reviews will make you fully aware of market trends! Being an InstaForex client, you are provided with a large number of free services for efficient trading.


