 Stay
Stay 
Trading Conditions
Products
Tools


On Monday, EUR/USD showed movements that one can only dream of. Not in the sense that they were perfect in terms of trading signals or fundamental analysis, but in the sense that they were volatile and trendy. At first, the pair fell significantly, then it rose even more. And it all happened with the calendar of macroeconomic events practically empty. The S&P Global manufacturing PMI came out in the morning. This was the final value for March, so traders already knew what to expect. In the afternoon and later in the evening, a similar index was released in the US, which just put more pressure on the dollar without any change in the traders' mood. And overall we saw that crossing the uptrend line means absolutely nothing. The fall has not even started, and the euro goes up again. Again, for no reason and it is strong again.
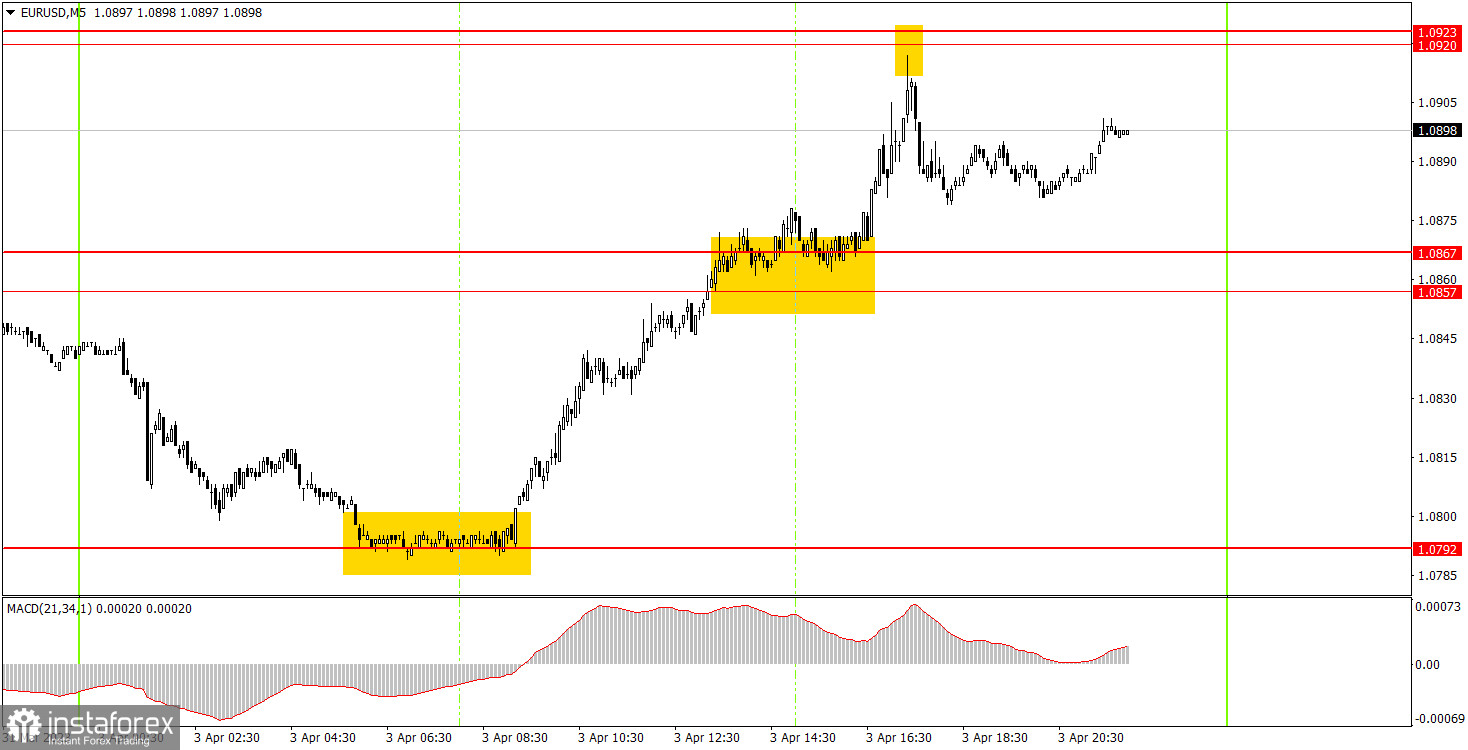
Speaking of trading signals, everything was just great. There was a perfect rebound from 1.0792 early morning, after which the pair went up by 100 pips and almost perfectly settled at 1.0920. The error amounted to only three pips. Beginners could have closed the long position on this signal, then they would have gained 100 pips. If not, then at any time, the profit would be about 85 pips, which is also very good. If someone worked with the sell signal, they would earn 15-20 points more. As a result, the first day of the week turned out to be very good.
On the 30-minute chart, the pair has consolidated below the new uptrend line and has already resumed the upward movement. This is all you need to know about what is happening in the market at the moment. Whatever happens, whatever the signals, in most cases, the euro is simply rising. The fundamental and macroeconomic background is almost irrelevant. On the 5-minute chart, it is recommended to trade at the levels 1.0587-1.0607, 1.0692, 1.0737, 1.0792, 1.0857-1.0867, 1.0920-1.0933, 1.0966, 1.0989, 1.1038, 1.1070. As soon as the price passes 15 pips in the right direction, you should set a Stop Loss to breakeven. On Tuesday, among all the events of the day, the only notable one is European Central Bank President Christine Lagarde's speech. As usual, we should not expect much from her, but maybe she will give some important information. Why do we need it now, though, when the euro is growing perfectly almost every day without it?
1) The strength of the signal is determined by the time it took the signal to form (a rebound or a breakout of the level). The quicker it is formed, the stronger the signal is.
2) If two or more positions were opened near a certain level based on a false signal (which did not trigger a Take Profit or test the nearest target level), then all subsequent signals at this level should be ignored.
3) When trading flat, a pair can form multiple false signals or not form them at all. In any case, it is better to stop trading at the first sign of a flat movement.
4) Trades should be opened in the period between the start of the European session and the middle of the US trading hours when all positions must be closed manually.
5) You can trade using signals from the MACD indicator on the 30-minute time frame only amid strong volatility and a clear trend that should be confirmed by a trendline or a trend channel.
6) If two levels are located too close to each other (from 5 to 15 pips), they should be considered support and resistance levels.
Support and Resistance levels are the levels that serve as targets when buying or selling the pair. You can place Take Profit near these levels.
Red lines are channels or trend lines that display the current trend and show in which direction it is better to trade now.
The MACD indicator (14, 22, and 3) consists of a histogram and a signal line. When they cross, this is a signal to enter the market. It is recommended to use this indicator in combination with trend patterns (channels and trendlines).
Important announcements and economic reports that can be found on the economic calendar can seriously influence the trajectory of a currency pair. Therefore, at the time of their release, we recommend trading as carefully as possible or exiting the market in order to avoid sharp price fluctuations.
Beginners on Forex should remember that not every single trade has to be profitable. The development of a clear strategy and money management is the key to success in trading over a long period of time.
InstaForex analytical reviews will make you fully aware of market trends! Being an InstaForex client, you are provided with a large number of free services for efficient trading.


