 Stay
Stay 
Trading Conditions
Products
Tools


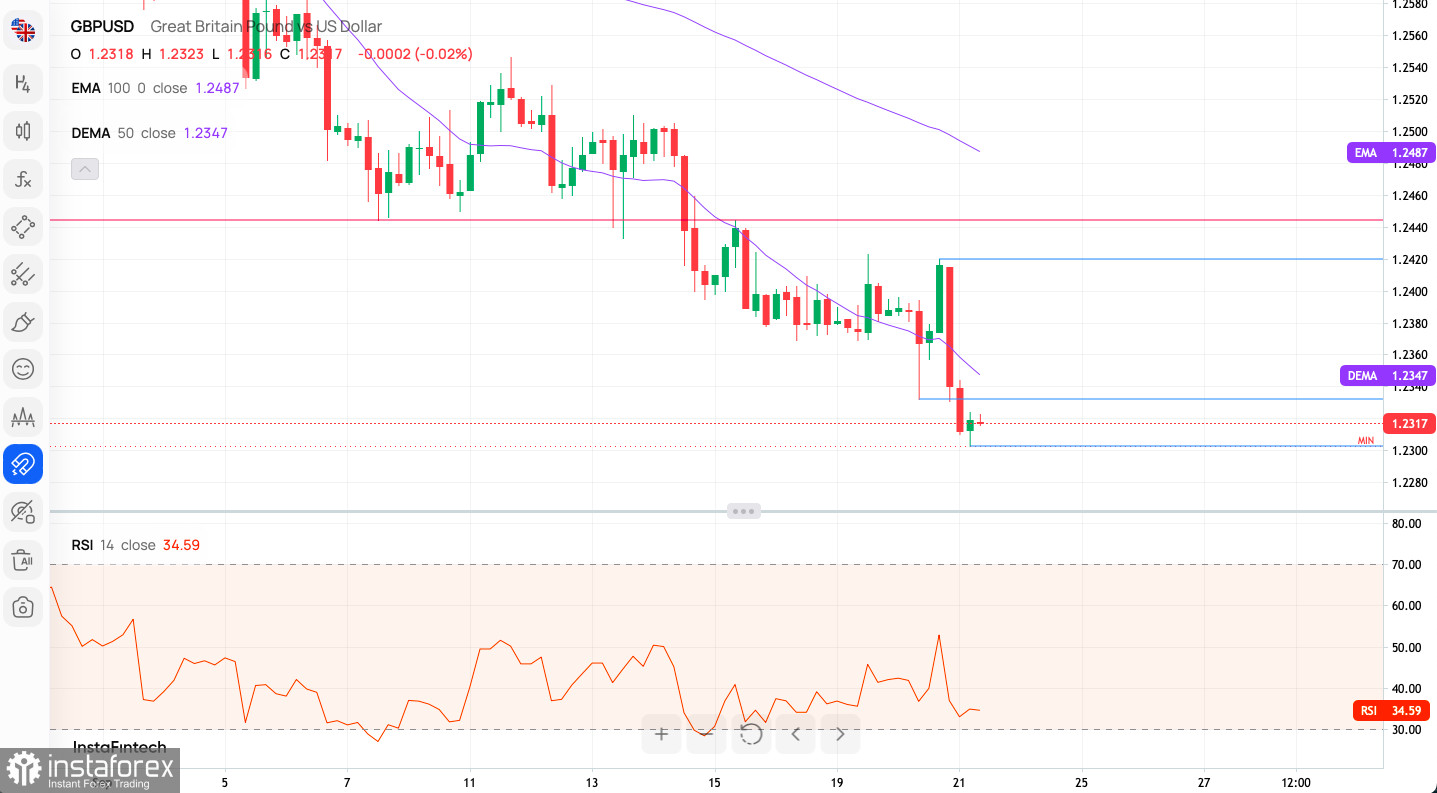
Technical Market Outlook:
The GBP/USD pair has made a new swing low at the level of 1.2303 after the US dollar strengthen across the board after the FED interest rate decision. This is the lowest level since May 2023. The down trend continues lower, the bears are still in charge of the market, which trades below the short-term trend line resistance, so any rejection of the short-term resistance seen at the level of 1.24444 will extend the drop lower towards the level of 1.2202 and 1.2283. The intraday technical resistance is seen at the level of 1.2332 and the intraday technical support is seen at the level of 1.2303 (last swing low). Despite the weak and negative momentum on the H4 time frame chart the short-term outlook for GBP is still bearish and more new lows should be made soon.
Weekly Pivot Points:
WR3 - 1.24341
WR2 - 1.24159
WR1 - 1.24095
Weekly Pivot - 1.23977
WS1 - 1.23913
WS2 - 1.23795
WS3 - 1.23613
Trading Outlook:
The bulls were rejected at the key technical resistance located at the level of 1.3163 and a breakout above this level is needed to extend the up trend towards the last Weekly swing high seen at 1.4248. The weekly time frame chart shows the Bearish Engulfing candlestick pattern was made during the breakout attempt above the 1.3163, so now the bears are in charge of the market. Any sustained breakout below the technical support seen at the level of 1.1775 would dramatically increase the chances of another leg down towards the level of 1.1494.
InstaForex analytical reviews will make you fully aware of market trends! Being an InstaForex client, you are provided with a large number of free services for efficient trading.


