 Stay
Stay 
Trading Conditions
Products
Tools


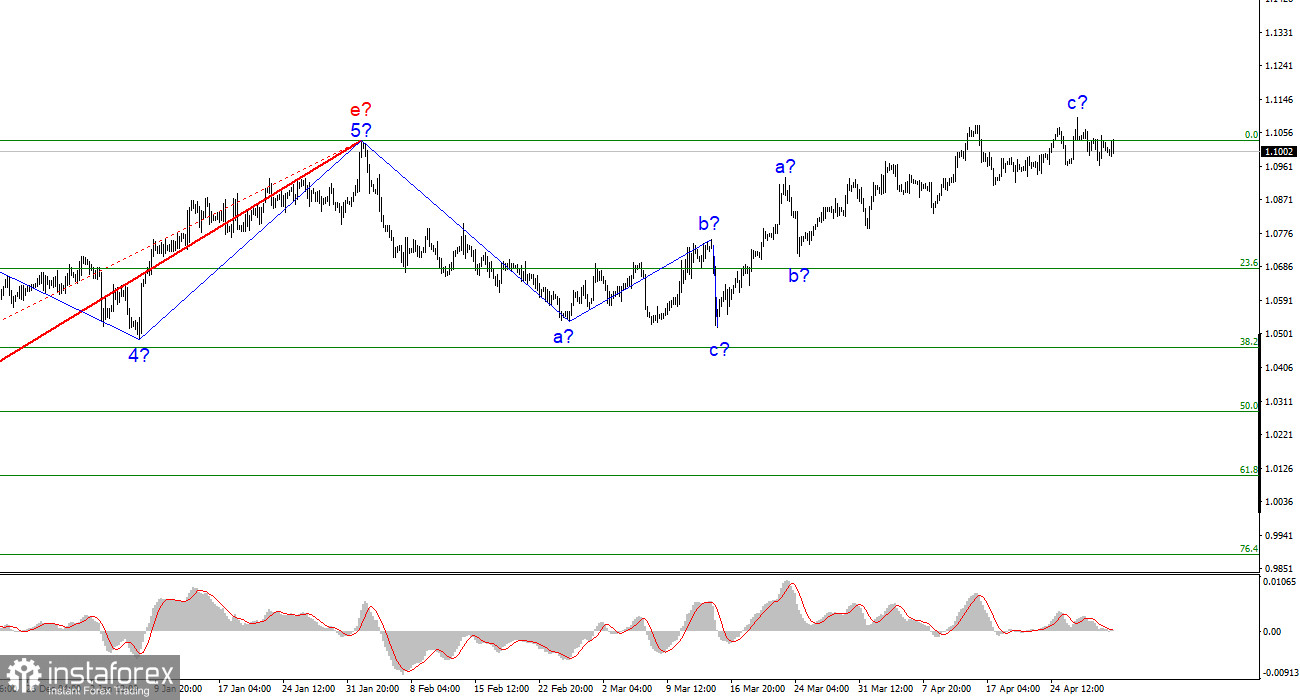
The wave analysis of the 4-hour chart for the euro/dollar pair continues to get tangled due to recent ascending waves, but overall, it has stayed the same in recent days and weeks. These waves could be an independent upward part of the trend (since the last downward move can be considered three-wave and completed), and they may also be nearing completion if it takes on a three-wave form. Thus, the wave pattern for the euro currency can become very complex, and it isn't easy to work with it now. At the current positions, the formation of the upward set of waves may be complete as the peak of the third wave has gone beyond the peak of the first. The same was seen in the last downward formation (minimal update of the low and completion of the segment). At the same time, there are other options for wave analysis. For example, a full-fledged five-wave (but also corrective) structure. It is now advisable to rely on a scenario with a decrease in the pair because the ascending three-wave structure looks complete and finished. Therefore, a new downward three-wave structure may begin to form soon, but a successful attempt to break the 1.1030 mark will indicate the market's readiness for new purchases.
Business activity is growing in the US manufacturing sector.
The euro/dollar pair fell by 35 basis points on Monday, but the decline could be stronger by the end of the day. The amplitude of the pair remains quite weak, and today it is about 25 basis points. During the day, only one important report could be addressed. In the US, the ISM business activity index in the manufacturing sector rose in April from 46.3 to 47.1 points. At the same time, the S&P business activity index in the manufacturing sector rose from 49.2 points to 50.2. It should be noted that the 50.0 mark is considered the "red line," below which any value is considered negative and above - positive. Although the ISM index remained below the "red line," it still rose slightly, and the S&P index exceeded this mark. Thus, the increase in demand for the US currency in the last couple of hours is justified. However, is this a one-time market charity event, or will the formation of a downward set of waves finally begin?
This week, there will be at least three major events that can help the dollar begin its climb. ECB meeting, FOMC meeting, and nonfarm payrolls report. Wednesday, Thursday, and Friday promise to be very "hot." It is difficult to expect a high value from nonfarm payrolls as monetary policy tightens and "cools" the economy and labor market. From the FOMC meeting, nothing else but an increase in the rate by another 25 basis points is expected. Anything can be expected from the ECB. Even now, many analysts believe that 50 points will raise the rate, while others think it will be 25. The regulator's decision will determine whether the euro will decline according to the current wave analysis or not.
Based on the analysis conducted, the formation of the upward segment of the trend is nearing completion. Therefore, it is advisable to recommend selling, and the pair has much room for decline. I think the targets in the range of 1.0500–1.0600 can be considered quite realistic. With these targets, I advise selling the pair on MACD indicator reversals "down" as long as the pair is below the 1.1030 mark, corresponding to 0.0% Fibonacci.
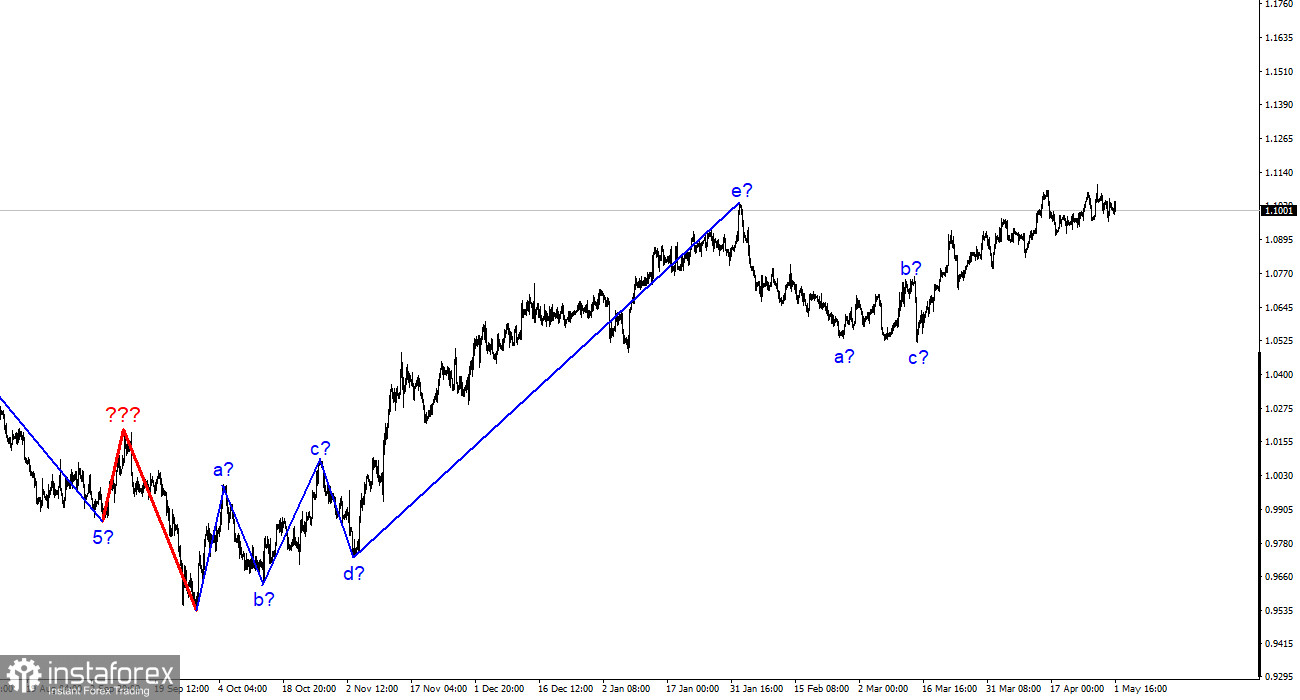
On the larger wave scale, the wave analysis of the ascending segment of the trend has taken on an extended form but is likely completed. We saw five waves, which are most likely an a-b-c-d-e structure. The formation of the downward segment of the trend may still need to be completed, and it can take any form in structure and extent.
InstaForex analytical reviews will make you fully aware of market trends! Being an InstaForex client, you are provided with a large number of free services for efficient trading.

