 Stay
Stay 
Trading Conditions
Products
Tools


Trend analysis
EUR/USD may move downwards from the level of 1.0847 (closing of the last weekly candle) to 1.0737, which is a 61.8% retracement level (blue dotted line). Upon reaching this price, the pair will bounce up to 1.0883, which is a historical resistance level (blue dotted line).
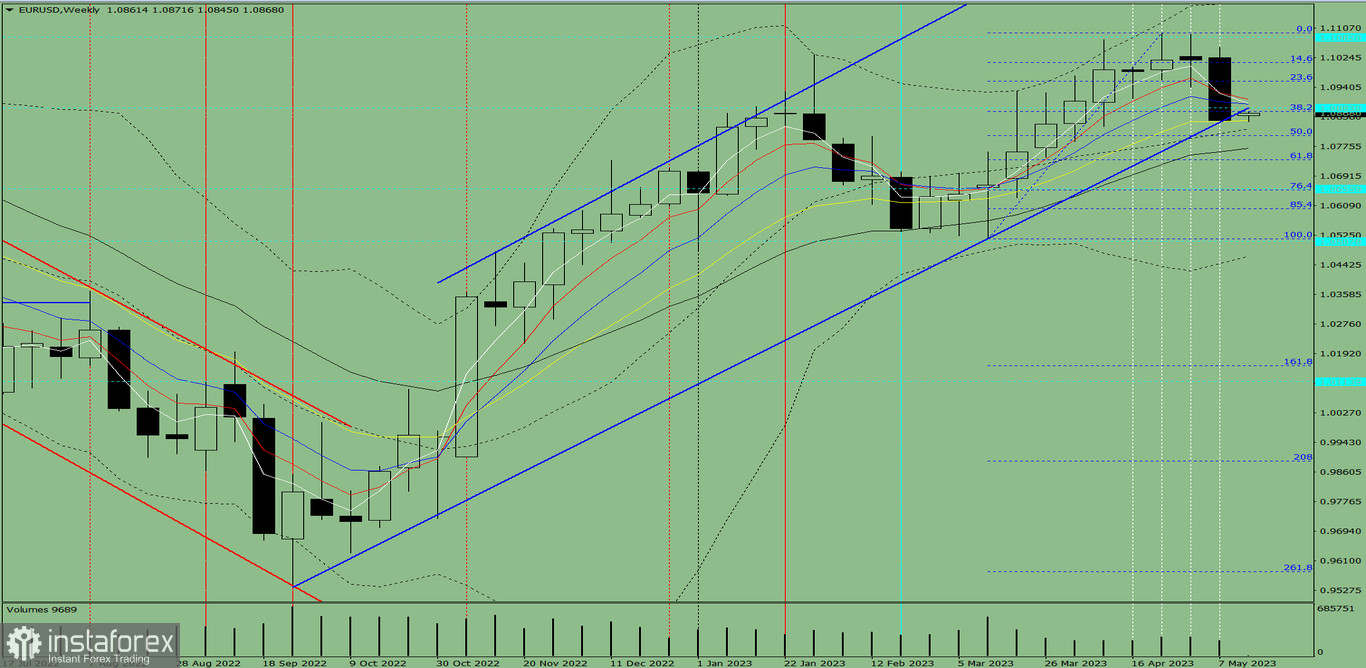
Fig. 1 (weekly chart)
Comprehensive analysis:
Indicator analysis - downward
Fibonacci levels - downward
Volumes - upward
Candlestick analysis - downward
Trend analysis - upward
Bollinger bands - upward
Monthly chart - downward
All this points to a downward movement in EUR/USD.
Conclusion: Most likely, the pair will have a bearish trend, with no first upper shadow on the weekly black candle (Monday - downward) and a second lower shadow (Friday - upward).
So during the week, euro will fall from 1.0847 (closing of the last weekly candle) to the 61.8% retracement level at 1.0737 (blue dotted line), and then climb upwards to the historical resistance level at 1.0883 (blue dotted line).
Alternatively, the quote may go down from 1.0847 (closing of the last weekly candle) to the 50.0% retracement level at 1.0805 (blue dotted line), and then bounce up to the historical resistance level at 1.0883 (blue dotted line).
InstaForex analytical reviews will make you fully aware of market trends! Being an InstaForex client, you are provided with a large number of free services for efficient trading.


