 Stay
Stay 
Trading Conditions
Products
Tools


On Friday, the EUR/USD pair began to correct after 10 days of decline. So far, the correction is very weak, and the price is trading inside a descending channel. Therefore, it is too early to draw conclusions about the end of the downtrend. The pair had grown illogically for a long time, so the current downward movement is extremely logical, even if the fundamental and macroeconomic backgrounds do not support it.
There was only one interesting event on Friday - the speech by Federal Reserve Chairman Jerome Powell. In short, Powell made it clear that the May rate hike is likely to be the last. The dollar fell about 50 pips after this statement, which looks like a mockery after a week and a half of growth. I still believe that the dollar should grow, and the European Central Bank and Federal Reserve rates no longer play a significant role for the market, as it had enough time to consider all the tightening of the monetary policy of both central banks. I don't expect the euro to strengthen unless quotes settle above the descending channel. It also has no long-term growth prospects.
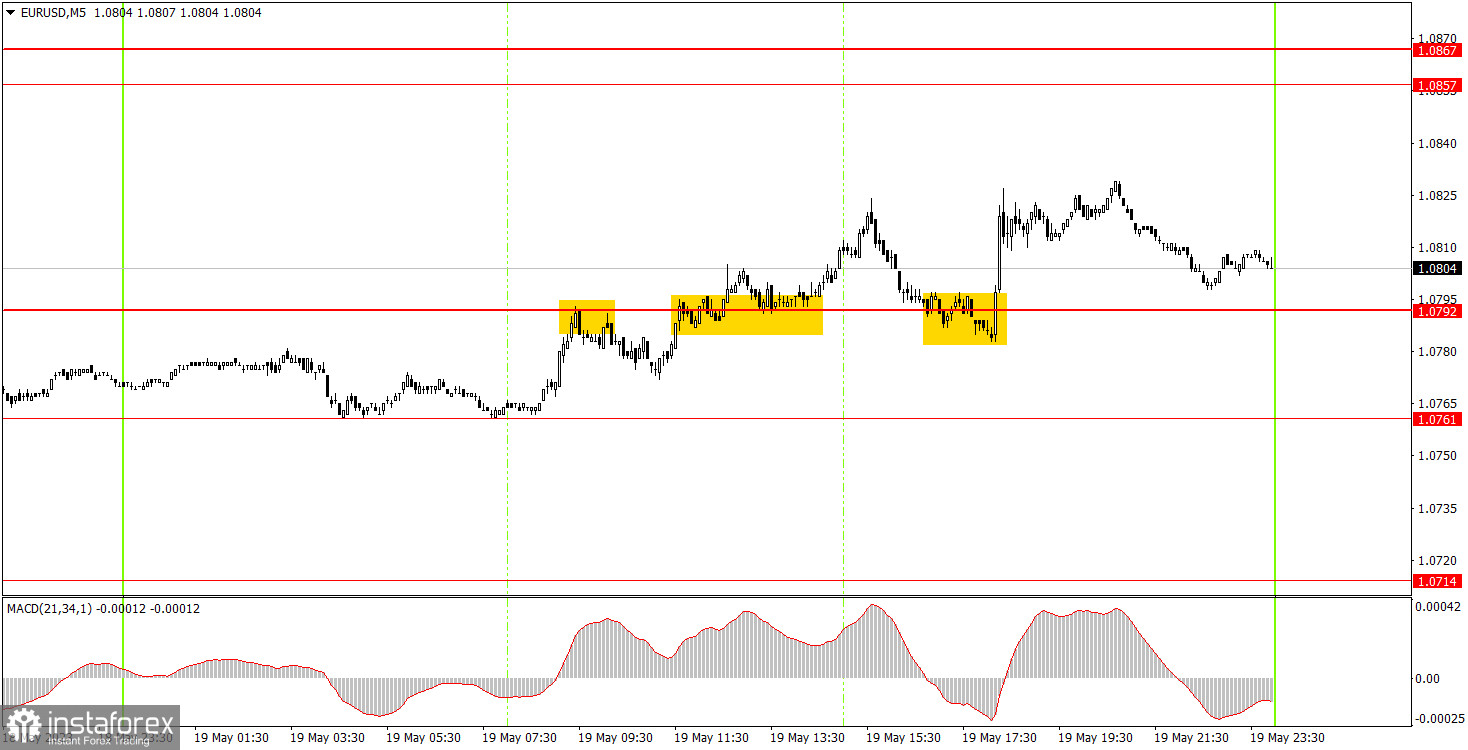
Three trading signals were formed on the 5-minute chart on Friday. First, the pair rebounded from the 1.0792 level, breached it, and then bounced off it from above. Volatility was 68 points, which is not much, given Powell's speech, in which he actually made statements. All three trading signals turned out to be false, and novice traders could try to work out only the first two. In the first case, the pair could not go down 15 points, so the deal resulted in a minor loss. In the second case, the deal could be closed resulting in a small profit, since it should have been liquidated manually before Powell's speech.
On the 30-minute chart, the pair continues to generally move downwards. The pair has shown prolonged downward movement for more than a week, which fully meets our expectations. Take note that the pair grew illogically for 2 months. A bullish correction may start soon, but the descending channel clearly indicates the preservation of the trend. On the 5-minute chart, the levels to pay attention to are 1.0587-1.0607, 1.0714, 1.0761, 1.0792, 1.0857-1.0867, 1.0920-1.0933, 1.0965-1.0980. When passing 15 points in the correct direction, you can set the Stop Loss to breakeven. On Monday, no interesting events are planned in the European Union, and several Fed representatives will give speeches in the United States. In fact, there is nothing to look forward to on Monday. Powell has already said the most important things.
1) The strength of the signal depends on the time period during which the signal was formed (a rebound or a break). The shorter this period, the stronger the signal.
2) If two or more trades were opened at some level following false signals, i.e. those signals that did not lead the price to Take Profit level or the nearest target levels, then any consequent signals near this level should be ignored.
3) During the flat trend, any currency pair may form a lot of false signals or do not produce any signals at all. In any case, the flat trend is not the best condition for trading.
4) Trades are opened in the time period between the beginning of the European session and until the middle of the American one when all deals should be closed manually.
5) We can pay attention to the MACD signals in the 30M time frame only if there is good volatility and a definite trend confirmed by a trend line or a trend channel.
6) If two key levels are too close to each other (about 5–15 pips), then this is a support or resistance area.
Support and Resistance price levels can serve as targets when buying or selling. You can place Take Profit levels near them.
Red lines are channels or trend lines that display the current trend and show which direction is better to trade.
MACD indicator (14,22,3) is a histogram and a signal line showing when it is better to enter the market when they cross. This indicator is better to be used in combination with trend channels or trend lines.
Important speeches and reports that are always reflected in the economic calendars can greatly influence the movement of a currency pair. Therefore, during such events, it is recommended to trade as carefully as possible or exit the market in order to avoid a sharp price reversal against the previous movement.
Beginners should remember that every trade cannot be profitable. The development of a reliable strategy and money management are the key to success in trading over a long period of time.
InstaForex analytical reviews will make you fully aware of market trends! Being an InstaForex client, you are provided with a large number of free services for efficient trading.


