 Stay
Stay 
Trading Conditions
Products
Tools


The main event on Tuesday was the publication of data on business activity indices in Europe, the United Kingdom, and the United States.
According to PMI statistical indicators, the business activity index in the services sector in Europe decreased from 56.2 to 55.9 points, while the business activity index in the manufacturing sector decreased from 45.8 to 44.6 points. As a result, the composite business activity index fell from 54.1 to 53.3 points.
In the United Kingdom, the business activity index in the services sector decreased from 55.9 to 55.1 points, while in the manufacturing sector, the index decreased from 47.8 to 46.9 points. Consequently, the composite business activity index fell from 54.9 to 53.9 points.
In the United States, the business activity index in the services sector rose from 53.6 to 55.1, despite the forecast decline to 52.6. The manufacturing sector index also declined from 50.2 to 48.5 points. As a result, the composite business activity index increased from 53.4 to 54.5 points.
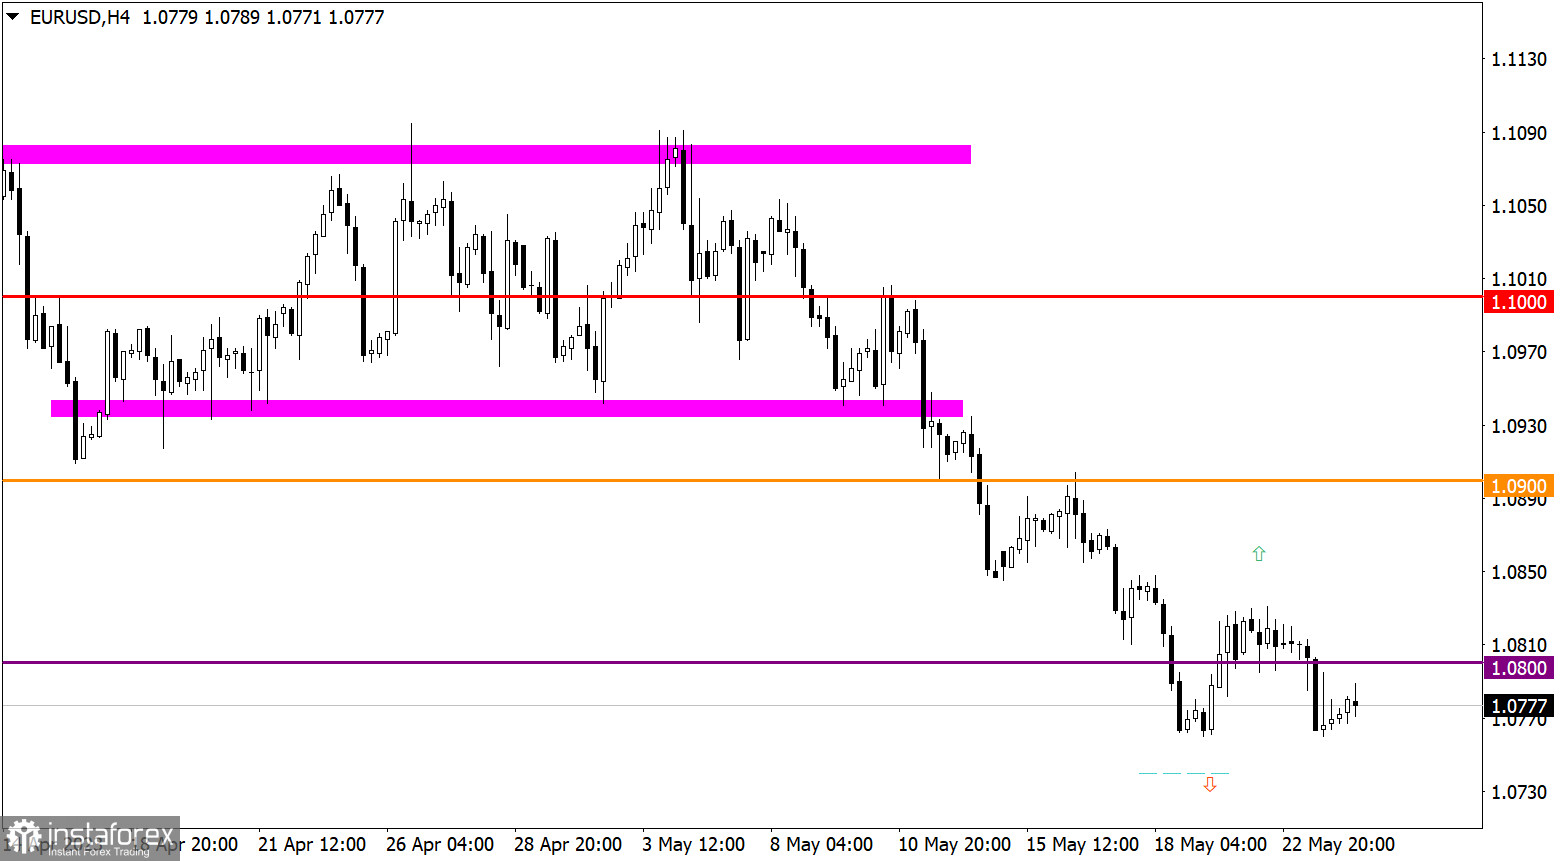
EUR/USD reduced the volume of short positions near last week's local low. This led to a price rebound, which may indicate a possible slowdown in the euro's downward trend.
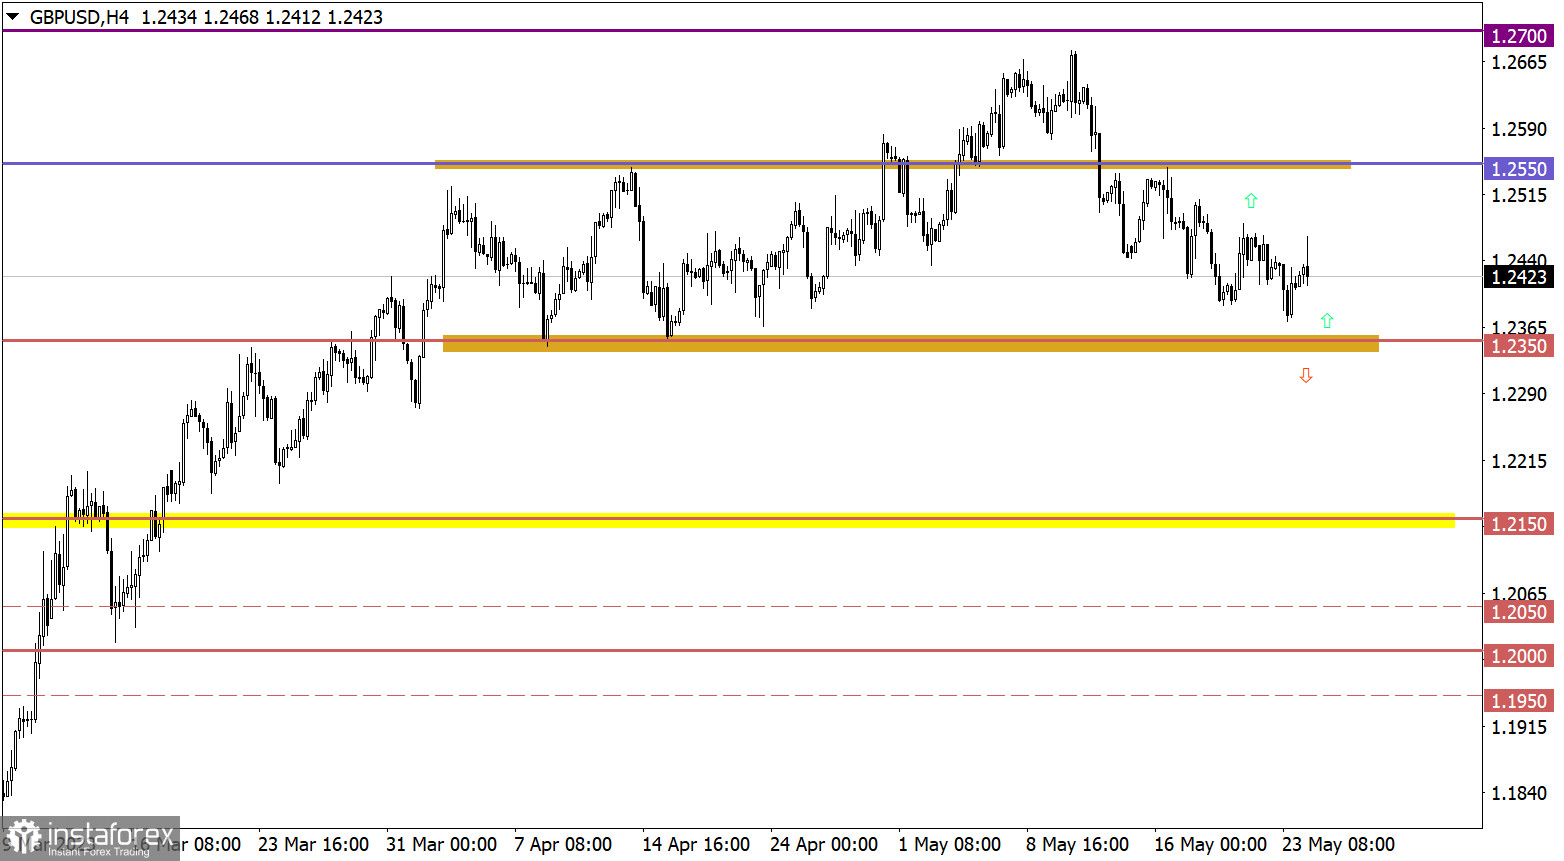
GBP/USD approached the support level zone of 1.2350, where a reduction in short positions occurred. As a result, a price rebound occurred, leading to a partial recovery of the pound's value.

Today, upon the opening of European markets, data on inflation in the United Kingdom was published, which fell from 10.1% to 8.7%. This is a good trend; however, a decrease to 8.3% was forecasted. The slight deviation in expectations played into the hands of speculators, who locally boosted the pound sterling exchange rate.
The current rebound may bring the exchange rate above the 1.0800 level, but it will not have a radical significance. The main technical signal for an increase in long positions volume will only be visible after the price remains above the 1.0850 level. Until that happens, there is a possibility of fluctuations in the range between 1.0750 and 1.0850.
For the first technical signal of the current corrective movement's completion to occur, the exchange rate needs to stay above the 1.2500 level. In such a scenario, there is a possibility of subsequent increase in long positions volume, which may open the way for further growth above the 1.2550 level. However, at the moment, the market continues its corrective movement, which may continue and bring the exchange rate back to the support level of 1.2350.
The candlestick chart type is white and black graphic rectangles with lines above and below. With a detailed analysis of each individual candle, you can see its characteristics relative to a particular time frame: opening price, closing price, intraday high and low.
Horizontal levels are price coordinates, relative to which a price may stop or reverse its trajectory. In the market, these levels are called support and resistance.
Circles and rectangles are highlighted examples where the price reversed in history. This color highlighting indicates horizontal lines that may put pressure on the asset's price in the future.
The up/down arrows are landmarks of the possible price direction in the future.
InstaForex analytical reviews will make you fully aware of market trends! Being an InstaForex client, you are provided with a large number of free services for efficient trading.


