 Stay
Stay 
Trading Conditions
Products
Tools


Trend analysis (Fig. 1).
The market may move downward from the level of 1.2360 (closing of yesterday's daily candle) with the target of 1.2331, the lower fractal (red dotted line). When testing this level, an upward movement is possible with the target of 1.2413, the 23.6% pullback level (red dotted line).
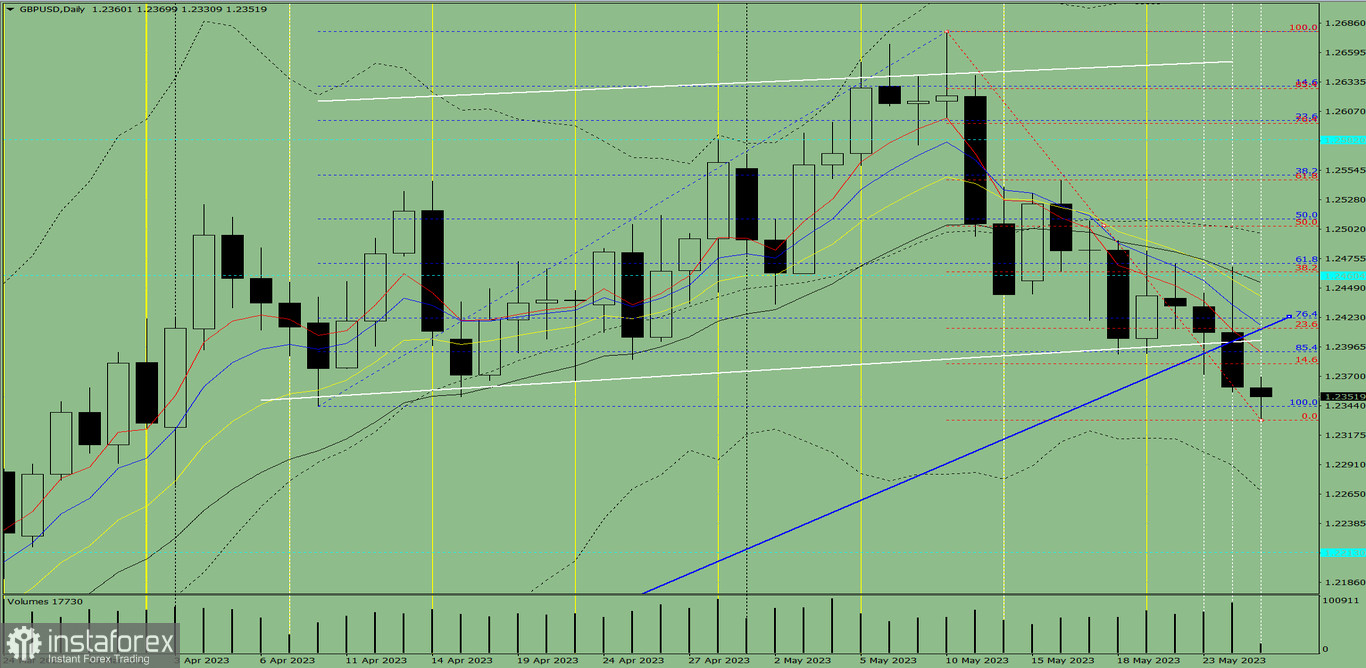
Fig. 1 (daily chart).
Comprehensive analysis:
General conclusion:
Today, the price may move downward from the level of 1.2360 (closing of yesterday's daily candle) with the target of 1.2331, the lower fractal (red dotted line). When testing this level, an upward movement is possible with the target of 1.2413, the 23.6% pullback level (red dotted line).
Alternatively, the price may move downward from the level of 1.2360 (closing of yesterday's daily candle) to 1.2268, the lower border of the Bollinger line indicator (black dotted line). When testing this level, an upward movement is possible with the target of 1.2413, the 23.6% pullback level (red dotted line).
InstaForex analytical reviews will make you fully aware of market trends! Being an InstaForex client, you are provided with a large number of free services for efficient trading.


