 Stay
Stay 
Trading Conditions
Products
Tools


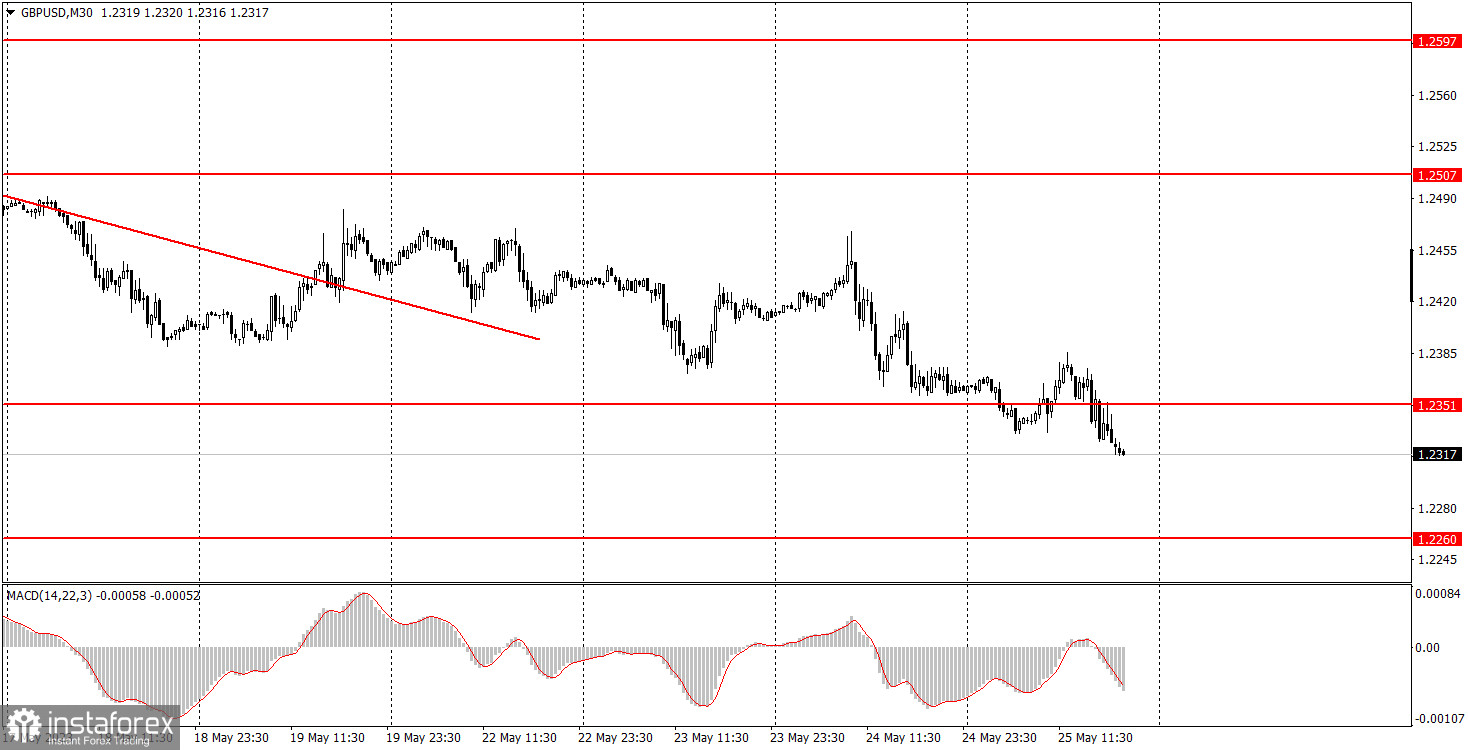
The GBP/USD pair also extended its downward movement on Thursday and broke through another support level on its way to 1.2351. Throughout the day, we saw a slight upward retracement, and volatility remained low. However, the British currency continues to fall regardless of the nature of the fundamental and macroeconomic backdrop. As we have mentioned before, we expect both the euro and the pound to decline as both European currencies have been growing unjustifiably for the past two months. Now is the time for reckoning.
By the way, Thursday's macroeconomic backdrop was on the dollar's side. There were no important events or reports in the UK, while the United States released two minor reports that came out stronger than expected. These reports include the second estimate of GDP for the first quarter and unemployment claims. Overall, we can even say that we witnessed a logical market reaction to the macro data, but we believe that the pair would have still fallen even without their help.
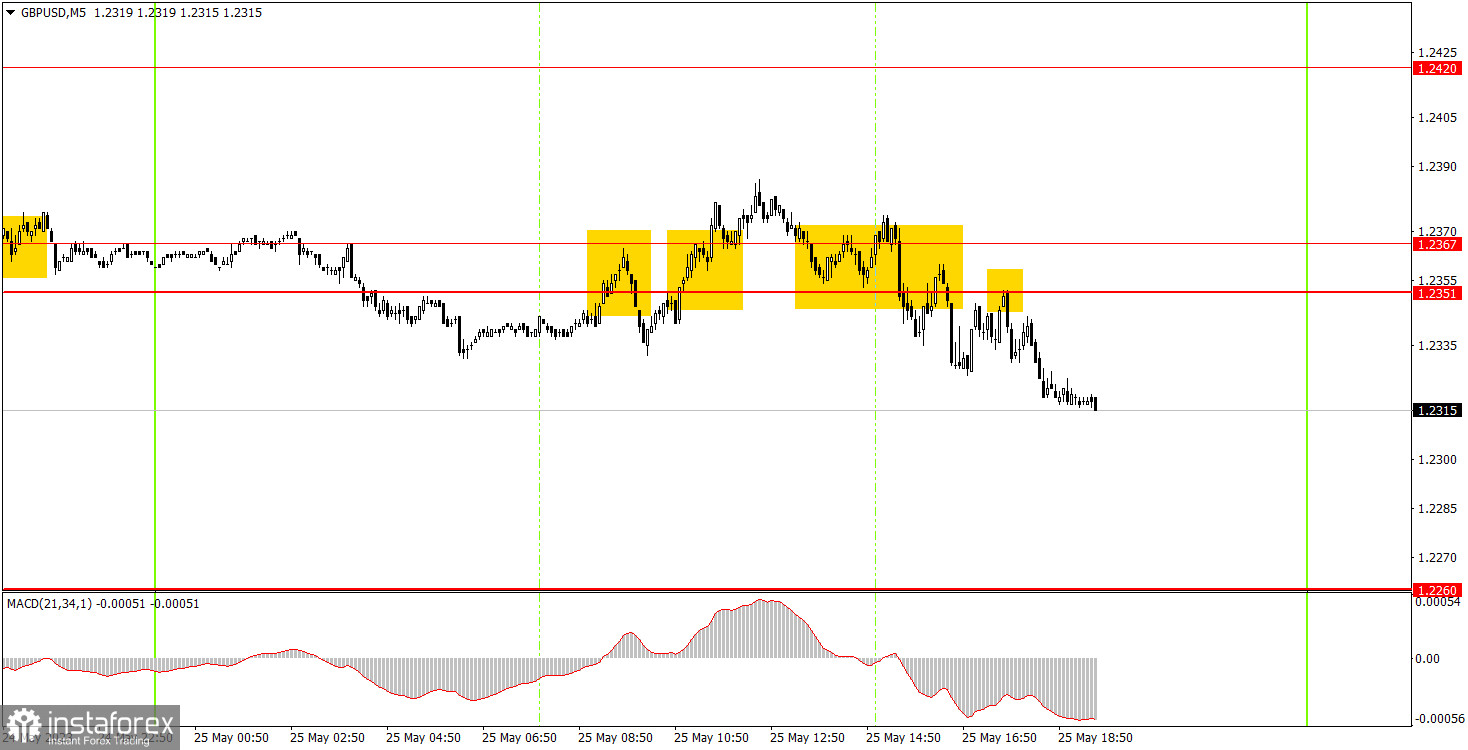
Four trading signals were formed on the 5-minute chart, all in the same area. This means that for most of the day, the pair was in a flat phase and then it fell again in the evening. We have already warned you that the nature of intraday movements is not very favorable: frequent upward retracements, a flat, and low volatility. It is currently better to trade in the medium-term. As for the signals, if anyone executed them, you should've only considered the first two. The pair did not even move in the right direction in both cases. Therefore, both resulted in a loss. Once again, we would like to emphasize that trading on the 5-minute chart is not the best idea at the moment.
As seen on the 30M chart, the GBP/USD pair tried to break the downtrend, as it breached the trendline last Friday. However, the pound did not strengthen, and we believe that the decline should continue almost regardless. Moreover, the current macroeconomic backdrop supports the dollar. The key levels on the 5M chart are 1.2171-1.2179, 1.2245-1.2260, 1.2351-1.2367, 1.2420, 1.2470, 1.2507-1.2520, 1.2597-1.2616. When the price moves 20 pips in the right direction after opening a trade, a stop loss can be set at breakeven. The UK only has one report scheduled for Friday, which is the Retail Sales report. However, in the US, four reports of relatively low significance will be released. Nevertheless, they will all be published within an hour and a half, so collectively they can influence the pair's movement.
1) The strength of the signal depends on the time period during which the signal was formed (a rebound or a break). The shorter this period, the stronger the signal.
2) If two or more trades were opened at some level following false signals, i.e. those signals that did not lead the price to Take Profit level or the nearest target levels, then any consequent signals near this level should be ignored.
3) During the flat trend, any currency pair may form a lot of false signals or do not produce any signals at all. In any case, the flat trend is not the best condition for trading.
4) Trades are opened in the time period between the beginning of the European session and until the middle of the American one when all deals should be closed manually.
5) We can pay attention to the MACD signals in the 30M time frame only if there is good volatility and a definite trend confirmed by a trend line or a trend channel.
6) If two key levels are too close to each other (about 5-15 pips), then this is a support or resistance area.
Support and Resistance price levels can serve as targets when buying or selling. You can place Take Profit levels near them.
Red lines are channels or trend lines that display the current trend and show which direction is better to trade.
MACD indicator (14,22,3) is a histogram and a signal line showing when it is better to enter the market when they cross. This indicator is better to be used in combination with trend channels or trend lines.
Important speeches and reports that are always reflected in the economic calendars can greatly influence the movement of a currency pair. Therefore, during such events, it is recommended to trade as carefully as possible or exit the market in order to avoid a sharp price reversal against the previous movement.
Beginners should remember that every trade cannot be profitable. The development of a reliable strategy and money management are the key to success in trading over a long period of time.
InstaForex analytical reviews will make you fully aware of market trends! Being an InstaForex client, you are provided with a large number of free services for efficient trading.


