 Stay
Stay 
Trading Conditions
Products
Tools


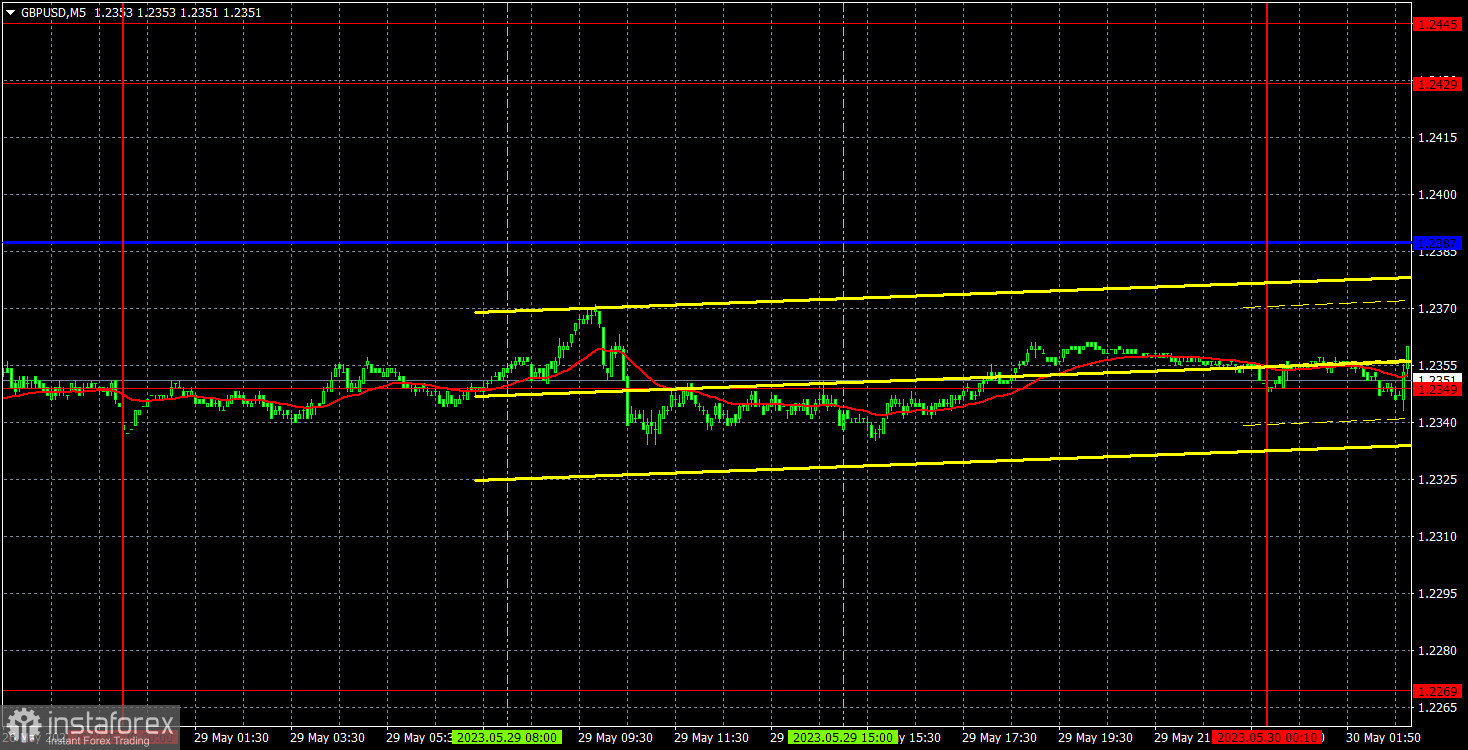
On Monday, GBP/USD was reluctant to move. While the euro still leaned towards a decline, the pound moved sideways all day. Moreover, the volatility in the British currency was even lower than in the euro. As we have previously mentioned, the pound is showing greater resilience compared to the euro. In other words, it refuses to fall and is more adamant to rise. However, the overall downtrend persists, so we expect the pound to fall. There was no macroeconomic or fundamental backdrop, and there was nothing to pay attention to. Traders were not interested in the news of the agreement on the US debt limit, as we expected.
There were no trading signals. The pair didn't even approach important levels or lines, so it was better not to trade. The flat was clear by the middle of the European trading session.
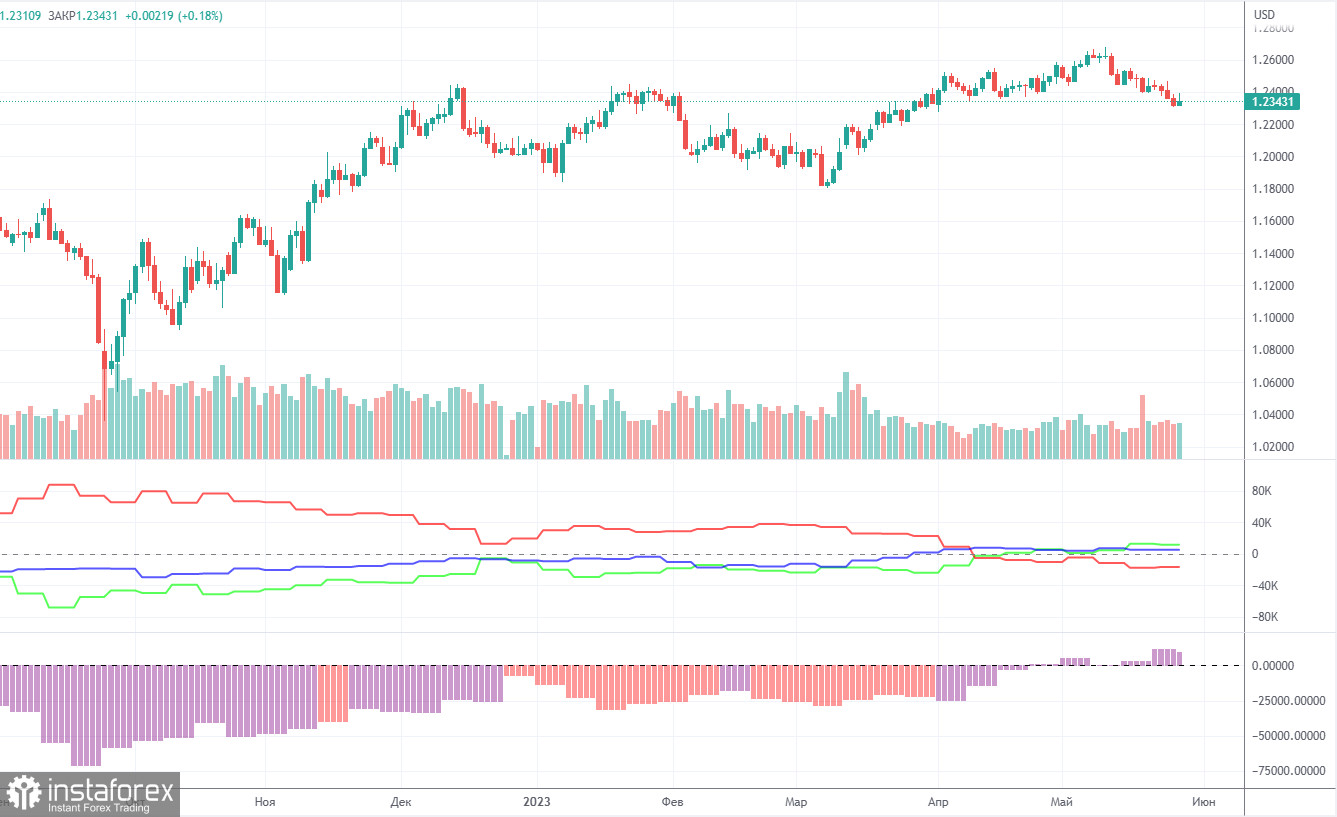
According to the latest report, non-commercial traders closed 8,100 long positions and closed 7,100 short ones. The net positions fell by 1,000 but remained bullish. Over the past 9-10 months, the net position has been on the rise despite bearish sentiment (only now can we say that it is bullish, but solely on a formal basis). We believe that the pound will continue to move down, although COT reports allow for further strengthening of the British currency. However, the market does not have any good reason to justify long positions.
Both major currency pairs are currently moving roughly the same way, but the net position for the euro is positive, implying the end of the uptrend, while for the pound, it is neutral. The pound has gained about 2,300 pips. And without a strong bearish correction, it would be completely illogical for the pound to rise further (even if we ignore the lack of fundamental support). Overall, non-commercial traders hold 57,600 sell positions and 69,200 long ones. We do not see the pair extending growth in the long term, but the market can do whatever it wants.
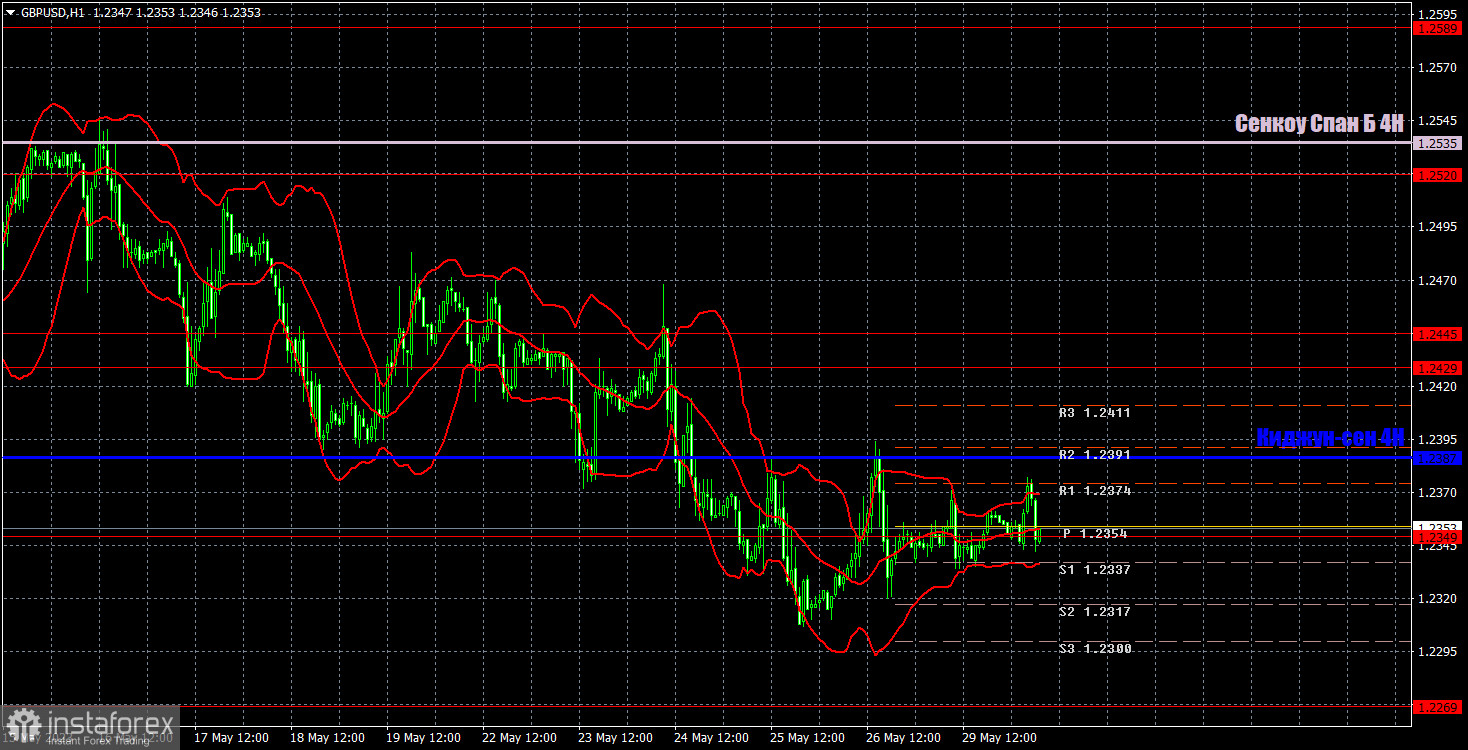
In the 1-hour time frame, the pair is moving down. The price is below all the lines of the Ichimoku indicator. We can expect the pair to fall further. There are currently no trend lines or channels, and the movements are quite erratic. However, the downtrend does not raise any questions or doubts.
On May 30, trading levels are seen at 1.2188, 1.2269, 1.2349, 1.2429-1.2445, 1.2520, 1.2589, 1.2666. The Senkou Span B line (1.2535) and the Kijun-sen line (1.2387) may also generate signals when the price either breaks or bounces off them. A Stop Loss should be placed at the breakeven point when the price goes 20 pips in the right direction. Ichimoku indicator lines can move intraday, which should be taken into account when determining trading signals. There are also support and resistance which can be used for locking in profits.
Today, the macroeconomic calendar of the UK and the US is empty. There are no minor reports or events. Traders will have nothing to react to. There is a high likelihood of a flat market and low volatility.
Resistance/support - thick red lines, near which the trend may stop. They do not make trading signals.
The Kijun-sen and Senkou Span B lines are the Ichimoku indicator lines moved to the hourly timeframe from the 4-hour timeframe. They are also strong lines.
Extreme levels are thin red lines, from which the price used to bounce earlier. They can produce trading signals.
Yellow lines are trend lines, trend channels, and other technical patterns.
Indicator 1 on the COT chart is the size of the net position of each trader category.
Indicator 2 on the COT chart is the size of the net position for the Non-commercial group of traders.
InstaForex analytical reviews will make you fully aware of market trends! Being an InstaForex client, you are provided with a large number of free services for efficient trading.


