 Stay
Stay 
Trading Conditions
Products
Tools


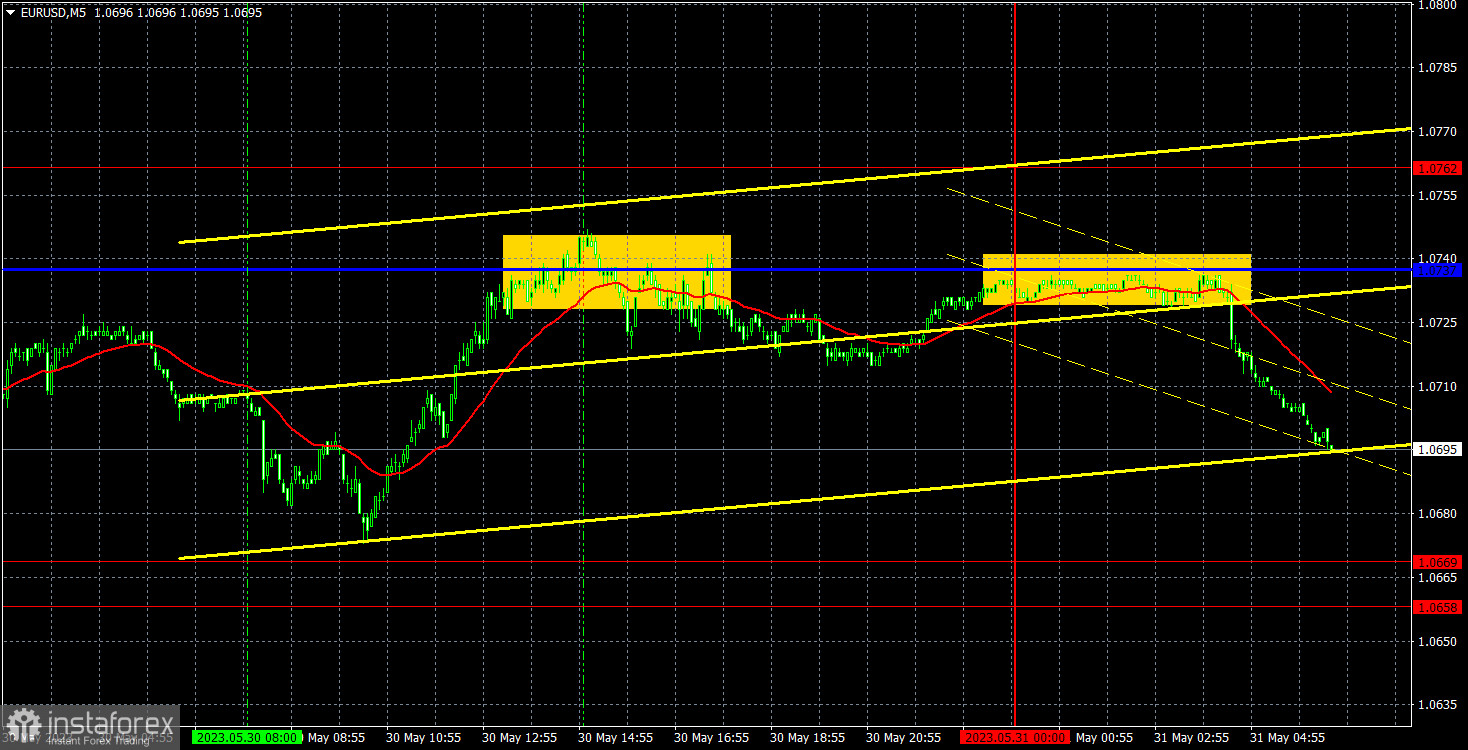
The EUR/USD pair suddenly moved up on Tuesday. Take note that there were no significant events or reports scheduled for Tuesday, so we expected a flat market. However, in the second half of the day, we did witness a flat market, as the most interesting moves occurred during the Asian and European trading sessions. It is also worth mentioning that the euro didn't trade significantly higher, as after several low-volatility days, even a 70-point movement appears impressive. It is definitely premature to conclude the end of the downtrend, even if it broke through the downward-sloping trendline on the hourly chart. As we can see, traders have started selling the pair again overnight, which aligns with our expectations.
There was only one signal for the day. The pair rebounded from a critical line during the US trading session, but a strong downward movement did not materialize. Nonetheless, there were no other signals until the evening, so you could have made a profit on this trade. Another sell signal was formed overnight, but the pair started to swiftly fall and it was before the start of the European trading session. Those who managed to act on this signal have done well, they could have gained around 25 pips of profit.
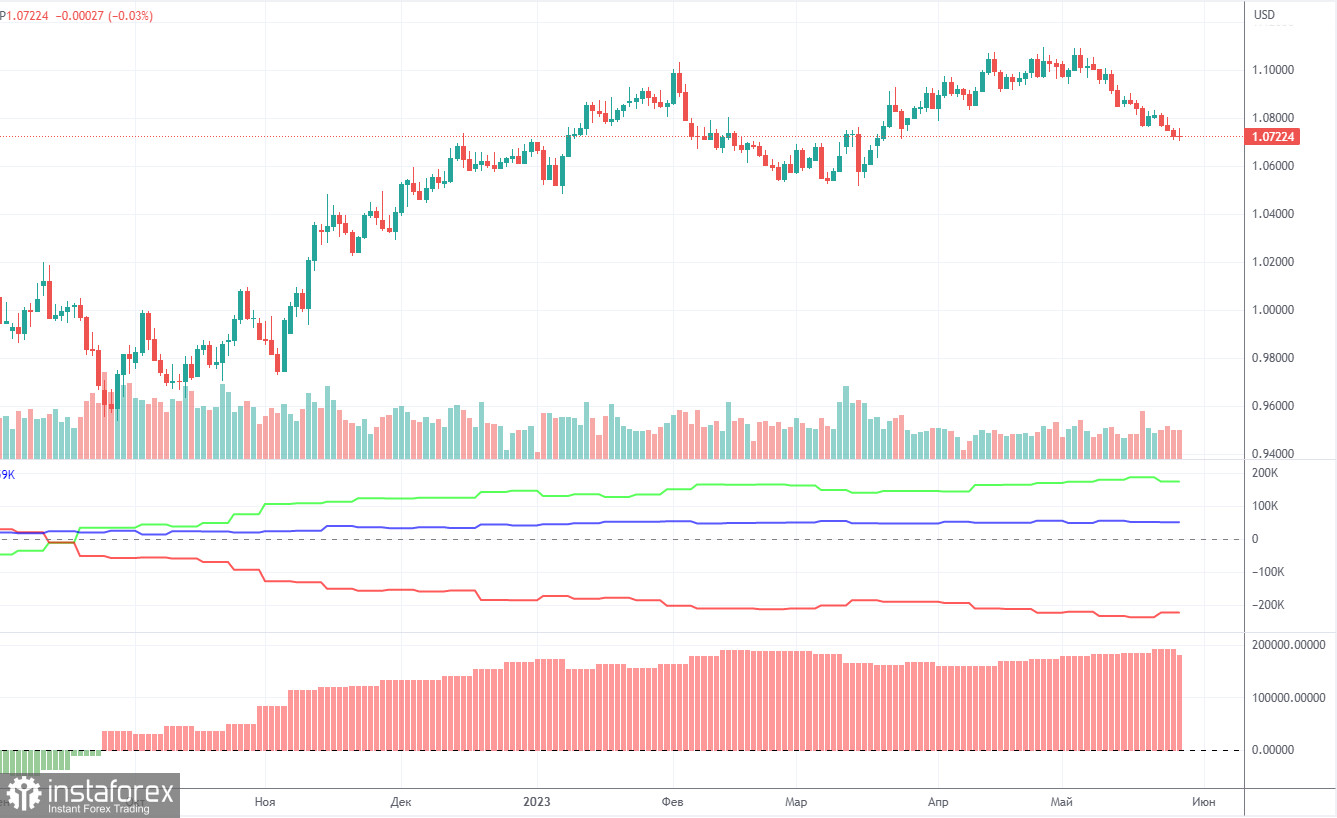
The COT report for May 23 was delivered on Friday. Over the past nine months, COT data has been in line with developments in the market. The net position (second indicator on the chart) has been on the rise since September 2022. The euro started to show strength approximately at the same time. Currently, the net non-commercial position is bullish and keeps growing further. Likewise, the euro is bullish.
Notably, we may assume by the extremely bullish net position that the uptrend may soon stop. The first indicator shows that, and the red and green lines are far away from each other, which is usually a sign that the end of the trend might be nearing. The euro attempted to go down several months ago, but those were just minor pullbacks. In the reporting week, long positions of non-commercial traders decreased by 8,600 and short positions rose by 4,700. The net position dropped by 13,300. The number of long positions exceeds that of short ones by 174,000, a rather big gap. A correction or a new downtrend has started. So, it is clear that the pair will be bearish even without COT reports.
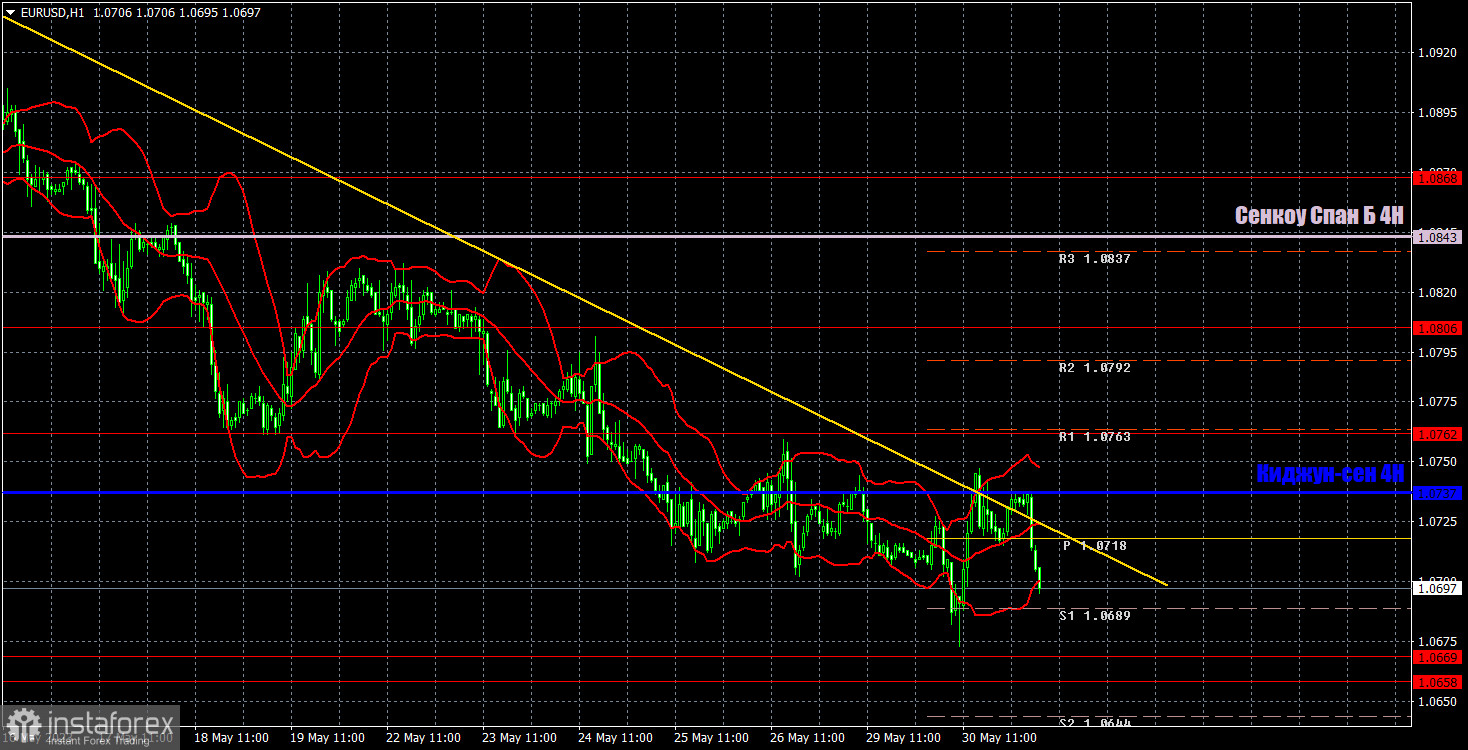
In the 1-hour time frame, the pair is still moving down. The trend is clear. The trendline is relevant. The price is below the Ichimoku lines. The trend is strong despite a sluggish fall every day. So, trades can be held for several days at least.
On May 31, trading levels are seen at 1.0537, 1.0581, 1.0658-1.0669, 1.0762, 1.0806, 1.0868, 1.0943, 1.1092, as well as the Senkou Span B line (1.0843) and the Kijun-sen line (1.0737) lines. Ichimoku indicator lines can move intraday, which should be taken into account when determining trading signals. There are also support and resistance although no signals are made near these levels. Signals could be made when the price either breaks or bounces from these extreme levels. Do not forget to place Stop Loss at the breakeven point when the price goes by 15 pips in the right direction. In case of a false breakout, it could save you from possible losses.
Today, European Central Bank President Christine Lagarde will deliver a speech in the European Union, while the report on job openings in April will be published in the United States. Lagarde's speech is inherently interesting. The US report can only trigger a reaction if its actual value significantly deviates from the forecast.
Resistance/support - thick red lines, near which the trend may stop. They do not make trading signals.
Kijun-sen and Senkou Span B are the Ichimoku indicator lines moved to the hourly timeframe from the 4-hour timeframe. They are also strong lines.
Extreme levels are thin red lines, from which the price used to bounce earlier. They can produce trading signals.
Yellow lines are trend lines, trend channels, and other technical patterns.
Indicator 1 on the COT chart is the size of the net position of each trader category.
Indicator 2 on the COT chart is the size of the net position for the Non-commercial group of traders.
InstaForex analytical reviews will make you fully aware of market trends! Being an InstaForex client, you are provided with a large number of free services for efficient trading.


