 Stay
Stay 
Trading Conditions
Products
Tools


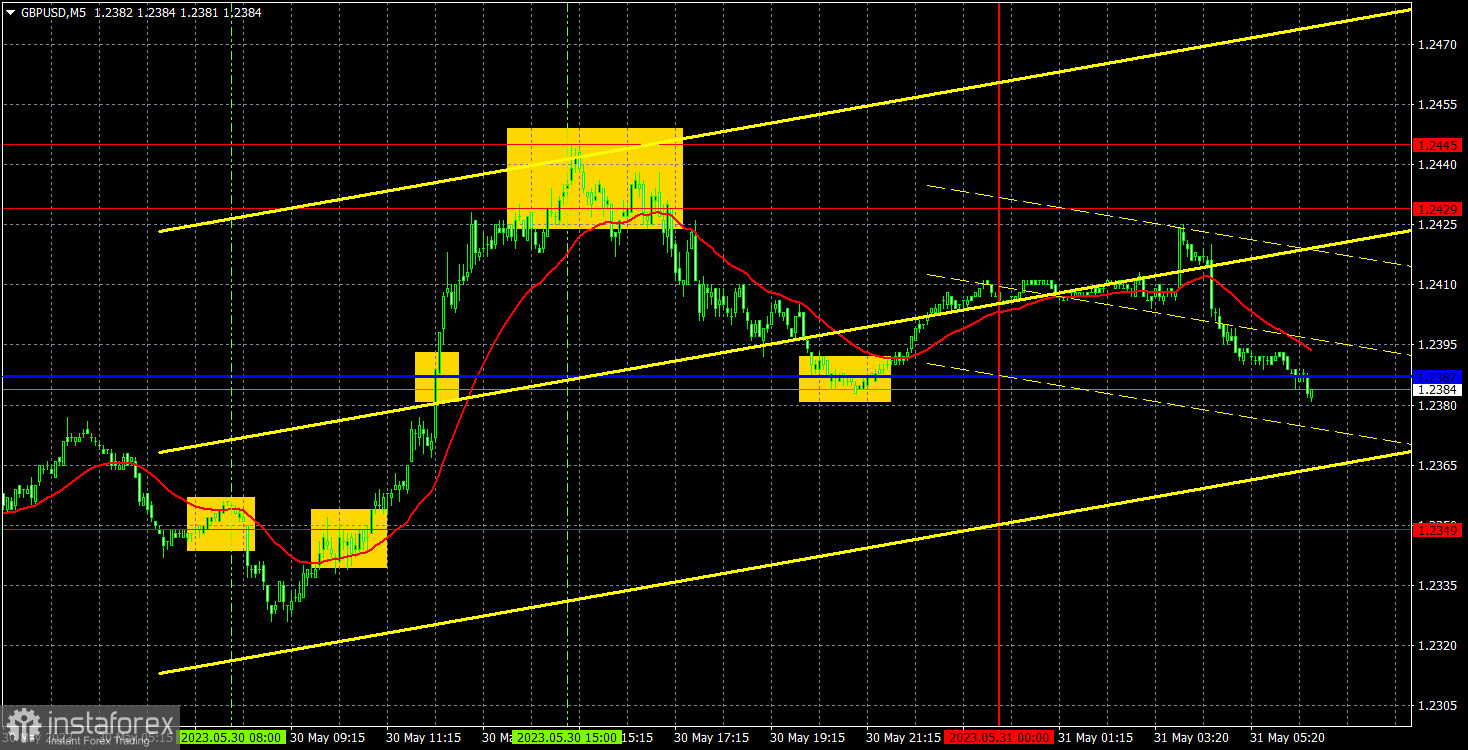
On Tuesday, GBP/USD showed strong growth for no reason. There were neither fundamental nor macroeconomic factors for that. The pound's morning increase could have been a delayed reaction of the market to the news about a debt limit deal between the GOP and Democrats that came on Monday. However, we believe that the downtrend is not over yet. The pound may fall once again and consolidate below the key line within the next few hours. With a row of macro releases coming today and in the next two days, volatility may increase.
A few trading signals came yesterday. Signals are generated whenever volatility rises. The first signal was to sell the instrument. It was a false one. The pair consolidated below 1.2349. It fell by just 14 pips, which was not enough to place a Stop Loss order at the breakeven level. The following signal was to buy. Quotes approached the range of 1.2429-1.2445 and pulled back, producing a sell signal. Traders earned about 60 pips from this trade and offset losses from the first one. It was also the time to open a short position. The price dropped to the Kijun-sen and bounced. Short positions brought a profit of some 20 pips more. Tuesday was a quite successful day for traders.
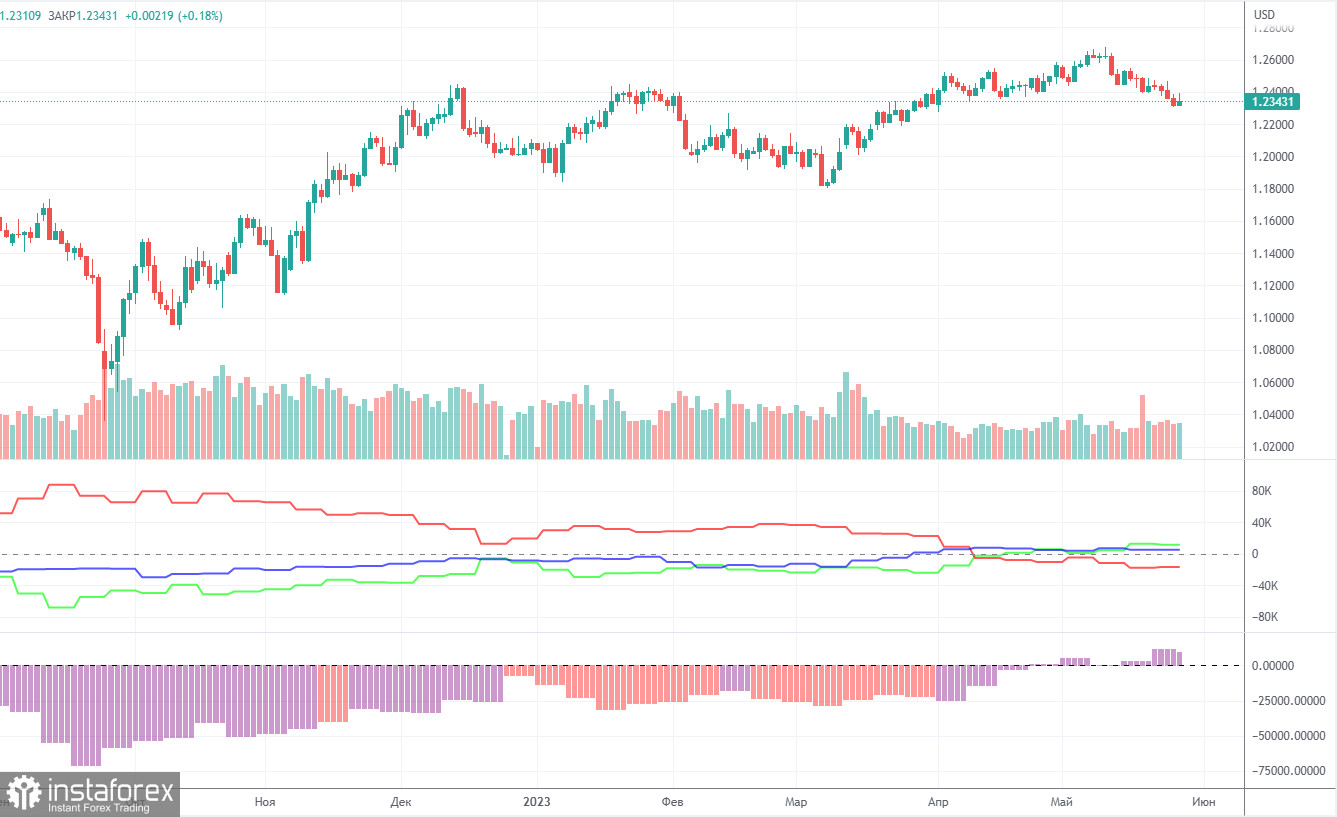
According to the latest report, non-commercial traders closed 8,100 long positions and 7,100 short ones. The net position dropped by 1,000 but remained bullish. Over the past 9-10 months, the net position has been on the rise despite bearish sentiment. The pound is bullish against the greenback in the medium term, but there have been hardly any reasons for that. We assume that a prolonged bear run has begun. COT reports suggest a bullish continuation. However, we can hardly explain why the uptrend should go on.
Both major pairs are in correlation now. At the same time, the positive net position on EUR/USD shows the end of the uptrend. Meanwhile, the net position on GBP/USD is neutral. The pound has gained about 2,300 pips. Therefore, a bearish correction is now needed. Otherwise, a bullish continuation would make no sense even despite the lack of support from fundamental factors. Overall, non-commercial traders hold 57,600 sell positions and 69,200 long ones. We do not see the pair extending growth in the long term.
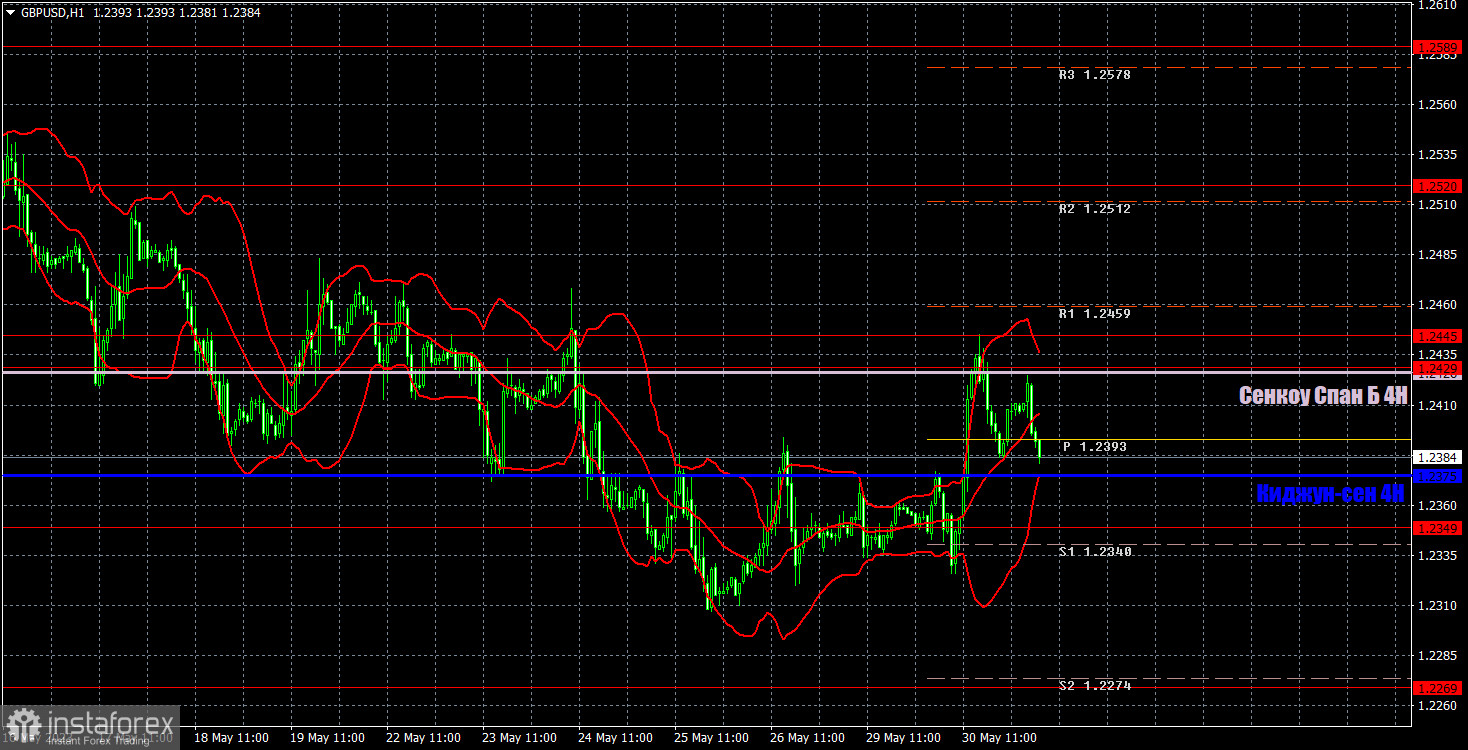
In the H1 time frame, GBP/USD is in a downtrend. Yesterday, it reached the Senkou Span B. Today, the pair may go below the line. Technically, there have been no reasons for a stronger pound sterling. Therefore, we expect the downtrend to continue.
On May 31, trading signals are seen at 1.2188, 1.2269, 1.2349, 1.2429-1.2445, 1.2520, 1.2589, and 1.2666. The Senkou Span B (1.2427) and Kijun-sen (1.2375) may also generate signals when the price either breaks or bounces off them. A Stop Loss should be placed at the breakeven point when the price goes 20 pips in the right direction. Ichimoku indicator lines can move intraday, which should be taken into account when determining trading signals. There are also support and resistance which can be used for locking in profits.
On Wednesday, no releases are scheduled in the UK. The US will deliver statistics on job openings, which will likely be of little interest to traders. In addition, some FOMC officials will speak.
Resistance/support - thick red lines, near which the trend may stop. They do not make trading signals.
The Kijun-sen and Senkou Span B lines are the Ichimoku indicator lines moved to the hourly timeframe from the 4-hour timeframe. They are also strong lines.
Extreme levels are thin red lines, from which the price used to bounce earlier. They can produce trading signals.
Yellow lines are trend lines, trend channels, and other technical patterns.
Indicator 1 on the COT chart is the size of the net position of each trader category.
Indicator 2 on the COT chart is the size of the net position for the Non-commercial group of traders.
InstaForex analytical reviews will make you fully aware of market trends! Being an InstaForex client, you are provided with a large number of free services for efficient trading.


