 Stay
Stay 
Trading Conditions
Products
Tools


On Wednesday, GBP/USD showed impressive growth for no reason. If taking a closer look, we may assume that a rise in price was justified. Indeed, some EU countries delivered inflation statistics in the past two days. Those reports showed a noticeable slowdown. In this light, the possibility of additional tightening from the ECB decreases. Because those figures had nothing to do with the UK and the pound, the pair was able to enter a technical correction. Moreover, it showed weakness after a hawkish statement from Cleveland FED President Loretta Mester. All in all, the pound strengthened for no reason. In the UK, no important macro releases were scheduled.
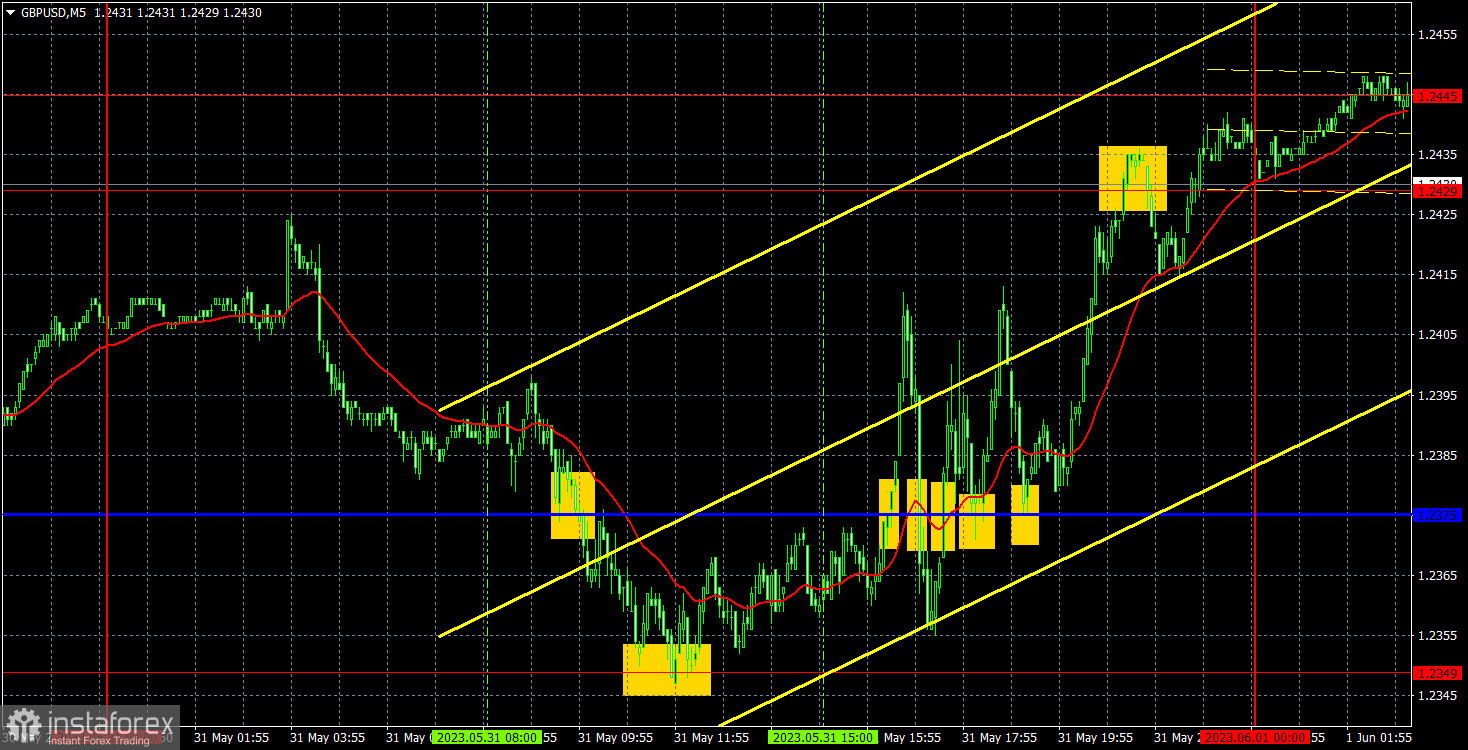
As for trading signals, there were plenty of them yesterday, especially in the American session. In the first half of the day, the pair consolidated below the Kijun-sen and bounced off 1.2349. Those two signals brought insignificant profit. In the American session, the pair reversed five times in two hours, each time breaking the key line. Naturally, signals were false. However, traders used the first two signals. In the first case, a Stop Loss triggered at the breakeven level. In the second case, small losses were incurred.
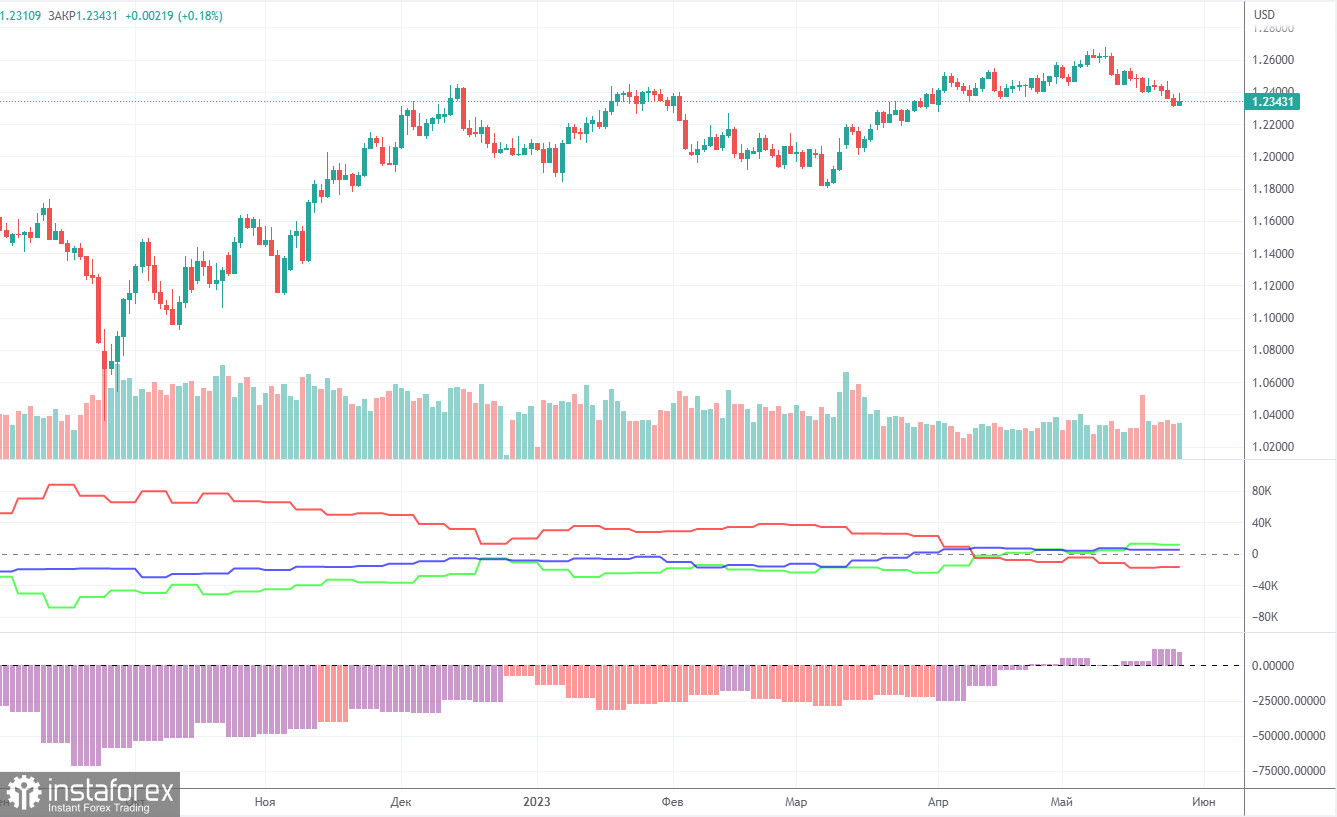
According to the latest report, non-commercial traders closed 8,100 long positions and 7,100 short ones. The net position dropped by 1,000 but remained bullish. Over the past 9-10 months, the net position has been on the rise despite bearish sentiment. The pound is bullish against the greenback in the medium term, but there have been hardly any reasons for that. We assume that a prolonged bear run has begun. COT reports suggest a bullish continuation. However, we can hardly explain why the uptrend should go on.
Both major pairs are in correlation now. At the same time, the positive net position on EUR/USD shows the end of the uptrend. Meanwhile, the net position on GBP/USD is neutral. The pound has gained about 2,300 pips. Therefore, a bearish correction is now needed. Otherwise, a bullish continuation would make no sense even despite the lack of support from fundamental factors. Overall, non-commercial traders hold 57,600 sell positions and 69,200 long ones. We do not see the pair extending growth in the long term.
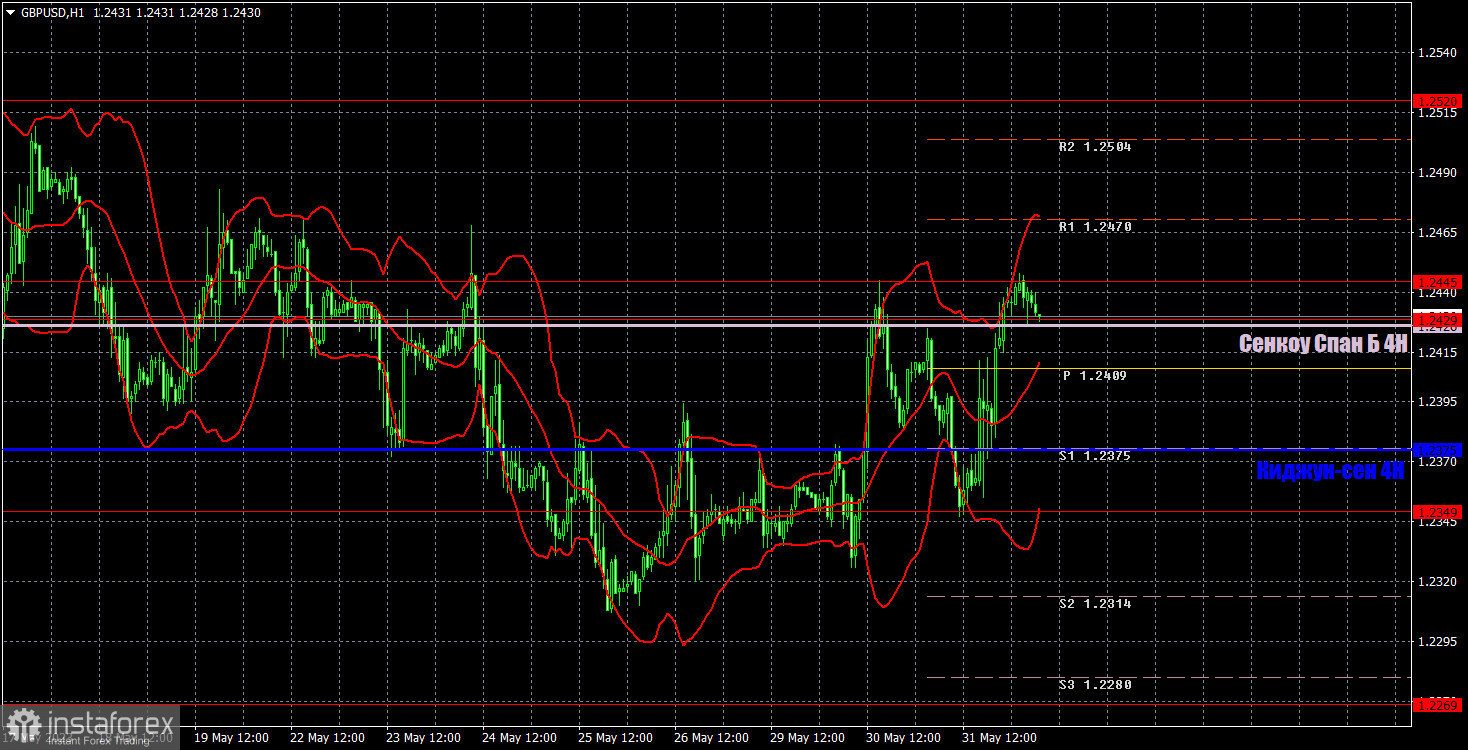
In the H1 time frame, there have been attempts to stop the current downtrend of GBP/USD for the second straight day. Yesterday, the price broke the Senkou Span B. However, to extend growth, the pair also needs to break the range of 1.2429-1.2445. The price may well pull back from it and resume the downtrend today. Moreover, there will be enough macro releases in the coming days that could provide support for the greenback.
On June 1, trading levels are seen at 1.2188, 1.2269, 1.2349, 1.2429-1.2445, 1.2520, 1.2589, and 1.2666. The Senkou Span B (1.2427) and Kijun-sen (1.2375) may also generate signals when the price either breaks or bounces off them. A Stop Loss should be placed at the breakeven point when the price goes 20 pips in the right direction. Ichimoku indicator lines can move intraday, which should be taken into account when determining trading signals. There are also support and resistance which can be used for locking in profits.
On Thursday, the UK will release a report on manufacturing business activity. In the US, data on jobless claims, ISM business activity, and the ADP employment change will be delivered. Volatility is expected to be at a high level. The price may frequently reverse during the day.
Resistance/support - thick red lines, near which the trend may stop. They do not make trading signals.
The Kijun-sen and Senkou Span B lines are the Ichimoku indicator lines moved to the hourly timeframe from the 4-hour timeframe. They are also strong lines.
Extreme levels are thin red lines, from which the price used to bounce earlier. They can produce trading signals.
Yellow lines are trend lines, trend channels, and other technical patterns.
Indicator 1 on the COT chart is the size of the net position of each trader category.
Indicator 2 on the COT chart is the size of the net position for the Non-commercial group of traders.
InstaForex analytical reviews will make you fully aware of market trends! Being an InstaForex client, you are provided with a large number of free services for efficient trading.


