 Stay
Stay 
Trading Conditions
Products
Tools


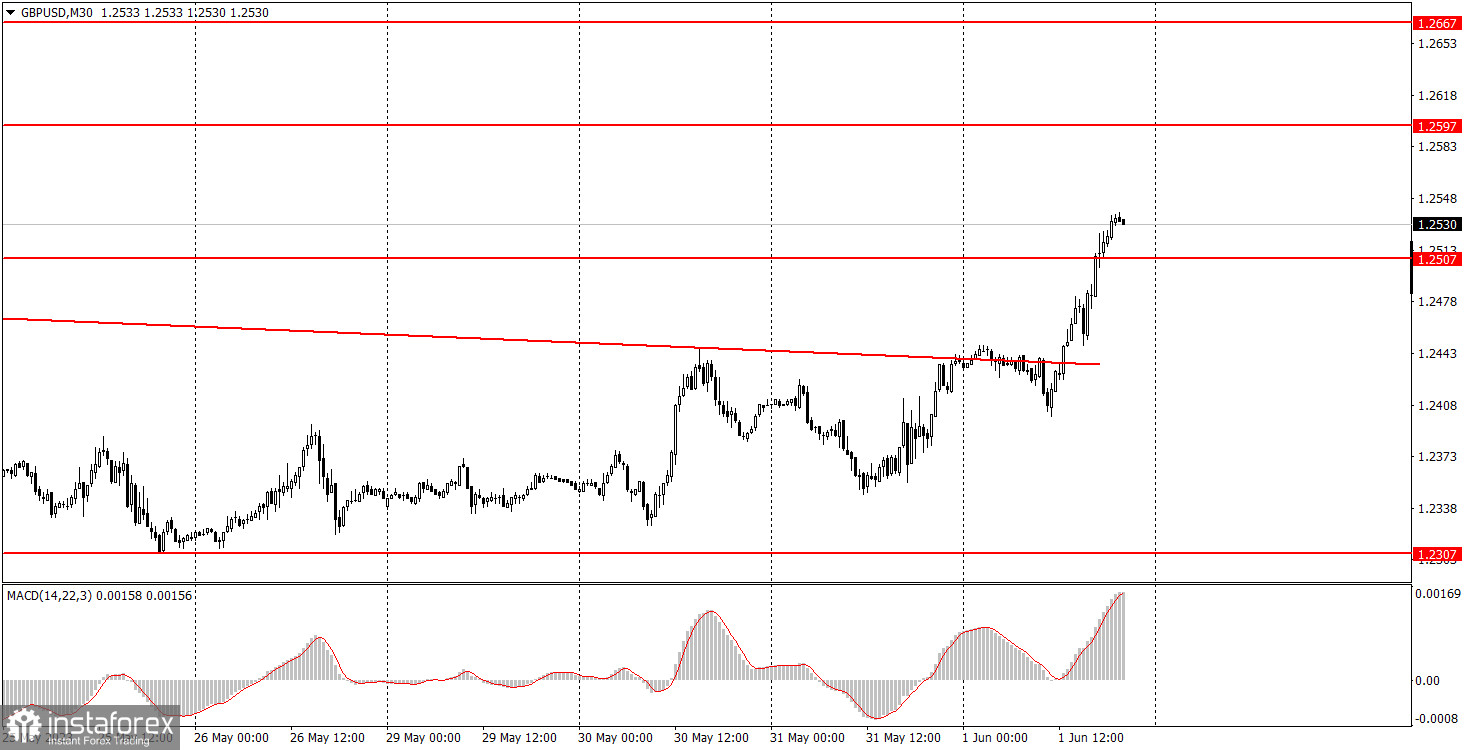
On Thursday, the GBP/USD pair broke through the second consecutive downward-sloping trendline, indicating a shift into an uptrend. Take note that the British pound had much fewer reasons to rise compared to the euro, yet it ended up increasing much more significantly. The macroeconomic and fundamental background for the euro had its own factors, while the British pound only had the Manufacturing PMI, which had a neutral value and couldn't provoke a strong growth.
Therefore, the pound is rising again without a solid basis. It hasn't fallen significantly in recent weeks to require an upward correction. The US data could have supported the dollar, but the market didn't pay attention to them. Although the ISM Manufacturing PMI remained below the 50 threshold and decreased by 0.2 points, the ADP report, which is an analogue of the NonFarm Payrolls, significantly exceeded the forecasted value. In general, there weren't substantial reasons for the dollar to decline so much on Thursday.
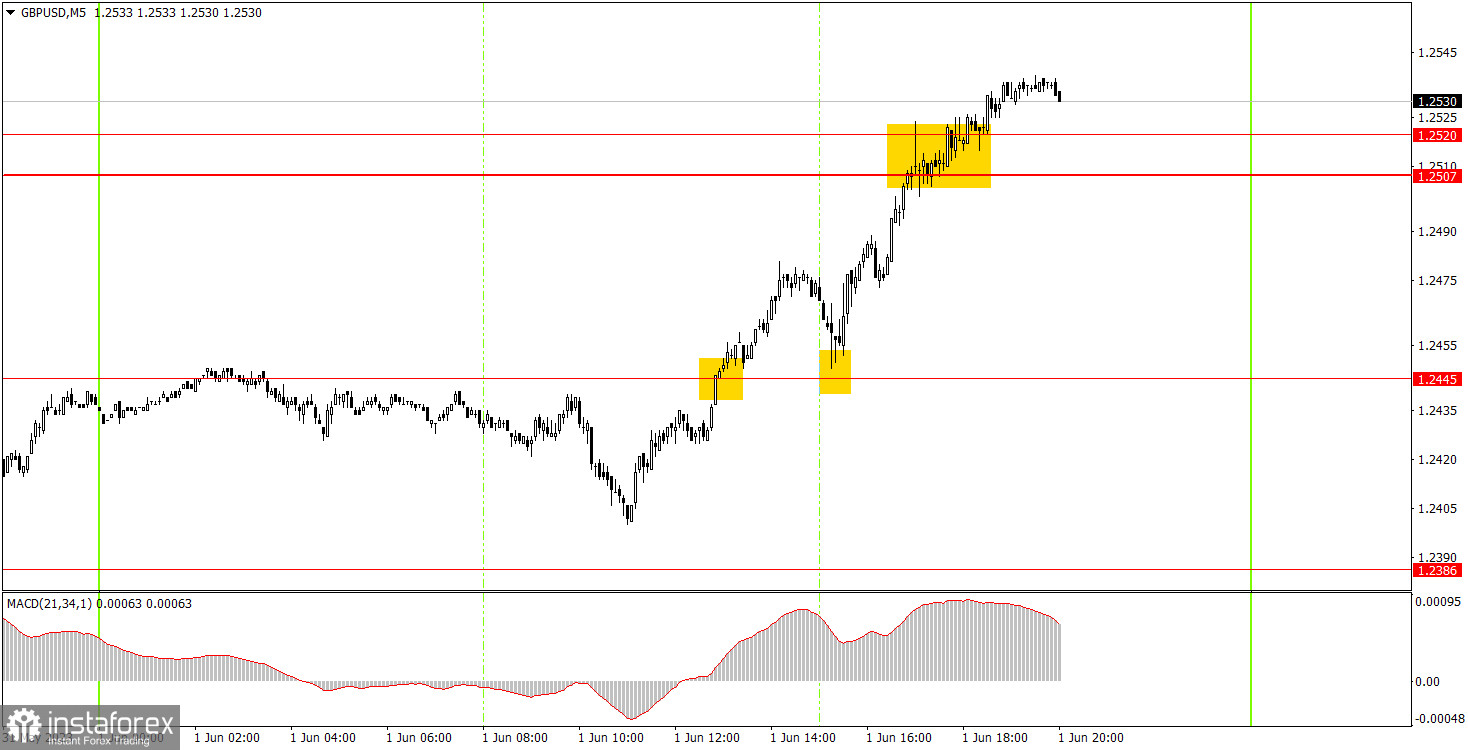
However, the trading signals on the 5-minute chart were quite good. The pair showed good intraday trending movement. The first buy signal formed around the 1.2445 level and was confirmed an hour later with a rebound with a small margin from the same level. Therefore, beginners could have opened a long position. Subsequently, the price reached the 1.2507-1.2520 area and surpassed it, where you should have taken profits. It amounted to 60-70 pips. The signal around the 1.2507-1.2520 area could have been ignored; beginners still achieved a good profit level without it.
As seen on the 30M chart, the GBP/USD pair has ended its downtrend and started a new uptrend in the short term. We believe that the pound hasn't fallen enough to form a strong uptrend, but the market may see it differently. There were specific buy signals, and Friday's US macro data could put pressure on the dollar. The key levels on the 5M chart are 1.2171-1.2179, 1.2245, 1.2307, 1.2386, 1.2445, 1.2507-1.2520, 1.2597-1.2616, 1.2659, 1.2697. When the price moves 20 pips in the right direction after opening a trade, a stop loss can be set at breakeven. On Friday, there are no important events scheduled in the United Kingdom. The US will release crucial reports on unemployment and the labor market, which are likely to provoke a strong market reaction unless their values coincide with the forecasts.
1) The strength of the signal depends on the time period during which the signal was formed (a rebound or a break). The shorter this period, the stronger the signal.
2) If two or more trades were opened at some level following false signals, i.e. those signals that did not lead the price to Take Profit level or the nearest target levels, then any consequent signals near this level should be ignored.
3) During the flat trend, any currency pair may form a lot of false signals or do not produce any signals at all. In any case, the flat trend is not the best condition for trading.
4) Trades are opened in the time period between the beginning of the European session and until the middle of the American one when all deals should be closed manually.
5) We can pay attention to the MACD signals in the 30M time frame only if there is good volatility and a definite trend confirmed by a trend line or a trend channel.
6) If two key levels are too close to each other (about 5-15 pips), then this is a support or resistance area.
Support and Resistance price levels can serve as targets when buying or selling. You can place Take Profit levels near them.
Red lines are channels or trend lines that display the current trend and show which direction is better to trade.
MACD indicator (14,22,3) is a histogram and a signal line showing when it is better to enter the market when they cross. This indicator is better to be used in combination with trend channels or trend lines.
Important speeches and reports that are always reflected in the economic calendars can greatly influence the movement of a currency pair. Therefore, during such events, it is recommended to trade as carefully as possible or exit the market in order to avoid a sharp price reversal against the previous movement.
Beginners should remember that every trade cannot be profitable. The development of a reliable strategy and money management are the key to success in trading over a long period of time.
InstaForex analytical reviews will make you fully aware of market trends! Being an InstaForex client, you are provided with a large number of free services for efficient trading.


