 Stay
Stay 
Trading Conditions
Products
Tools


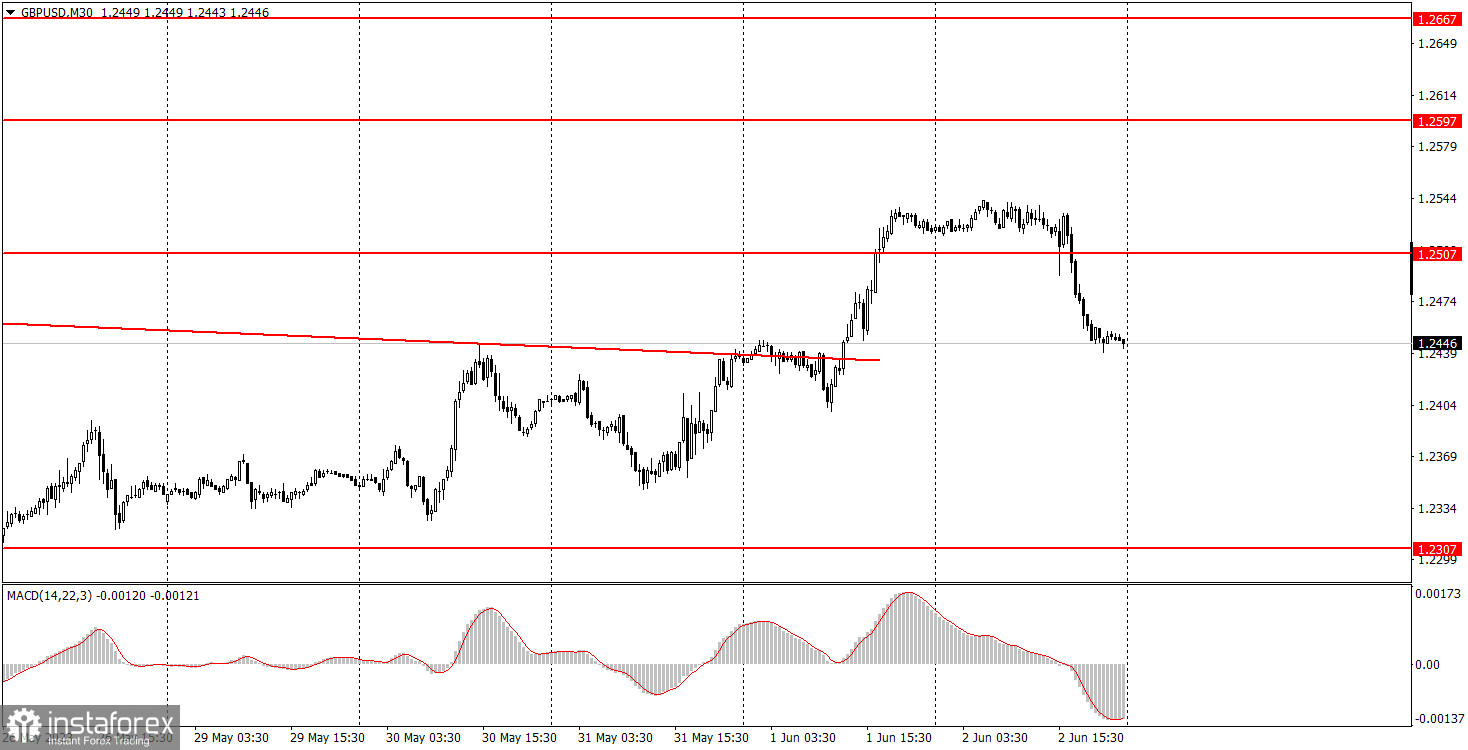
The GBP/USD pair exhibited identical movements on Friday. It remained flat during the European trading session and experienced a decline during the US session. Therefore, there is no need to repeat the details. The strengthening of the US currency was naturally triggered by the Nonfarm Payrolls report, which significantly exceeded expectations. However, the downward trendline (the second one) was previously breached, which technically made an uptrend. Nevertheless, we still don't see any reasons for the British currency to show growth in the medium-term perspective, so we expect the pair to fall. There were no important data or events in the UK, and the pair demonstrated logically consistent movements on Friday.
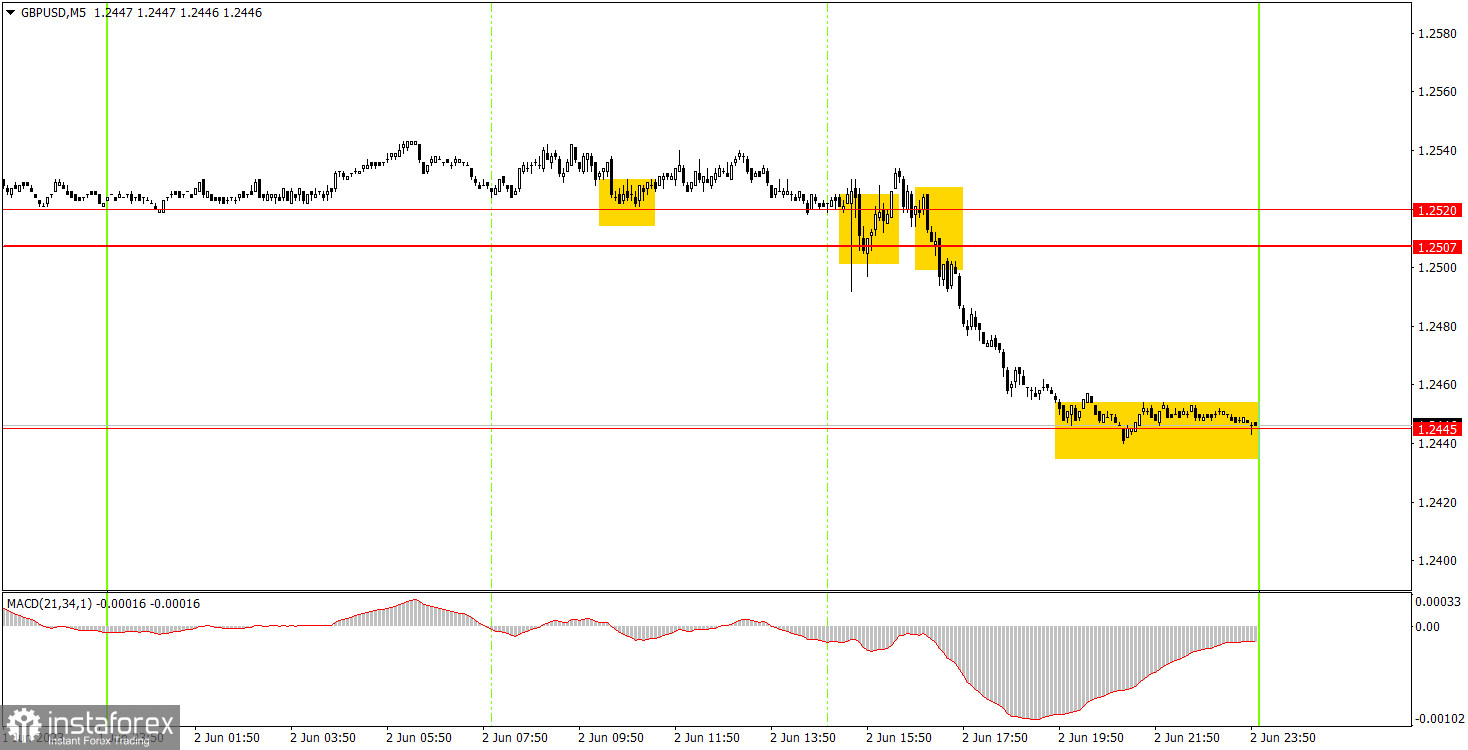
On the 5-minute chart, Friday's trading signals were not the best due to the flat during the first half of the day. There was only one signal during that time, which was a buy signal near the level of 1.2520, and it should have been closed with the opening of the US trading session, as important data was expected to be released in the US, which could have caused the pair to move in any direction. After its release, there was a buy signal when the pair traded in the 1.2507-1.2520 range, but it should have been ignored as the values of the US reports clearly favored the dollar. However, the next sell signal should have been traded. Eventually, the price dropped to the level of 1.2445, where short positions should have been closed. The profit amounted to approximately 40 pips.
As seen on the 30M chart, the GBP/USD pair has ended its downtrend and started a new uptrend in the short-term. We believe that the pound has not fallen enough to form a new strong uptrend, but the market may have a different opinion. Important data will be released this week, so we recommend analyzing higher charts to understand the potential direction of the price. The key levels on the 5M chart are 1.2171-1.2179, 1.2245, 1.2307, 1.2386, 1.2445, 1.2507-1.2520, 1.2597-1.2616, 1.2659, 1.2697. When the price moves 20 pips in the right direction after opening a trade, a stop loss can be set at breakeven. On Monday, the UK has only scheduled the release of the Services PMI, which may provoke a reaction. In the US, there will also be business activity indices in the service sector, including the ISM index, which is considered important.
1) The strength of the signal depends on the time period during which the signal was formed (a rebound or a break). The shorter this period, the stronger the signal.
2) If two or more trades were opened at some level following false signals, i.e. those signals that did not lead the price to Take Profit level or the nearest target levels, then any consequent signals near this level should be ignored.
3) During the flat trend, any currency pair may form a lot of false signals or do not produce any signals at all. In any case, the flat trend is not the best condition for trading.
4) Trades are opened in the time period between the beginning of the European session and until the middle of the American one when all deals should be closed manually.
5) We can pay attention to the MACD signals in the 30M time frame only if there is good volatility and a definite trend confirmed by a trend line or a trend channel.
6) If two key levels are too close to each other (about 5-15 pips), then this is a support or resistance area.
Support and Resistance price levels can serve as targets when buying or selling. You can place Take Profit levels near them.
Red lines are channels or trend lines that display the current trend and show which direction is better to trade.
MACD indicator (14,22,3) is a histogram and a signal line showing when it is better to enter the market when they cross. This indicator is better to be used in combination with trend channels or trend lines.
Important speeches and reports that are always reflected in the economic calendars can greatly influence the movement of a currency pair. Therefore, during such events, it is recommended to trade as carefully as possible or exit the market in order to avoid a sharp price reversal against the previous movement.
Beginners should remember that every trade cannot be profitable. The development of a reliable strategy and money management are the key to success in trading over a long period of time.
InstaForex analytical reviews will make you fully aware of market trends! Being an InstaForex client, you are provided with a large number of free services for efficient trading.


