 Stay
Stay 
Trading Conditions
Products
Tools


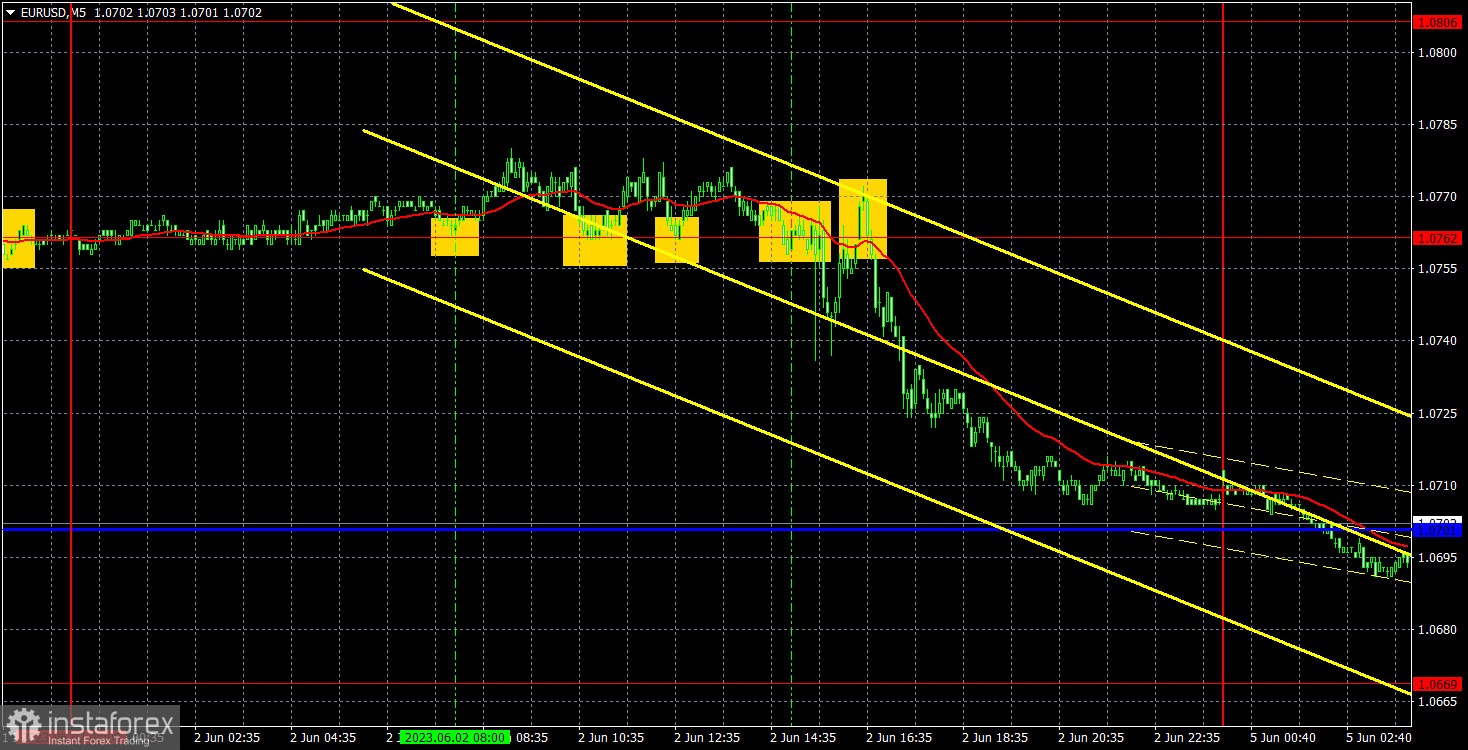
The EUR/USD pair sharply fell on Friday. Volatility was high, but the day can be roughly divided into two parts: before Nonfarm Payrolls (NFP) and after. Prior to the release of US data, the market was relatively flat. This is not surprising as there were no significant events or reports in the first half of the day. After the release of the NFP data, the pair sharply fell, which was logical, as the data exceeded expectations. Moreover, it exceeded forecasts twice as much, which speaks for itself: the US labor market is in excellent condition, despite the high interest rates set by the Federal Reserve. The increase in the unemployment rate by 0.3% was no longer of particular importance.
Trading signals were not the best due to the morning flat. During the European trading session, the pair rebounded from the level of 1.0762 thrice and failed to move up even by 10 pips each time. After the release of the NFP data, the pair initially started to decline, then returned to the level of 1.0762, and then it fell again. Since the NFP data was very strong, it was reasonable to consider only trades that anticipated the dollar's growth, in other words, selling opportunities. The last sell signal resulted in a profit of about 40 pips. The morning trade (which was only one) could have been closed at breakeven due to the same flat market conditions.
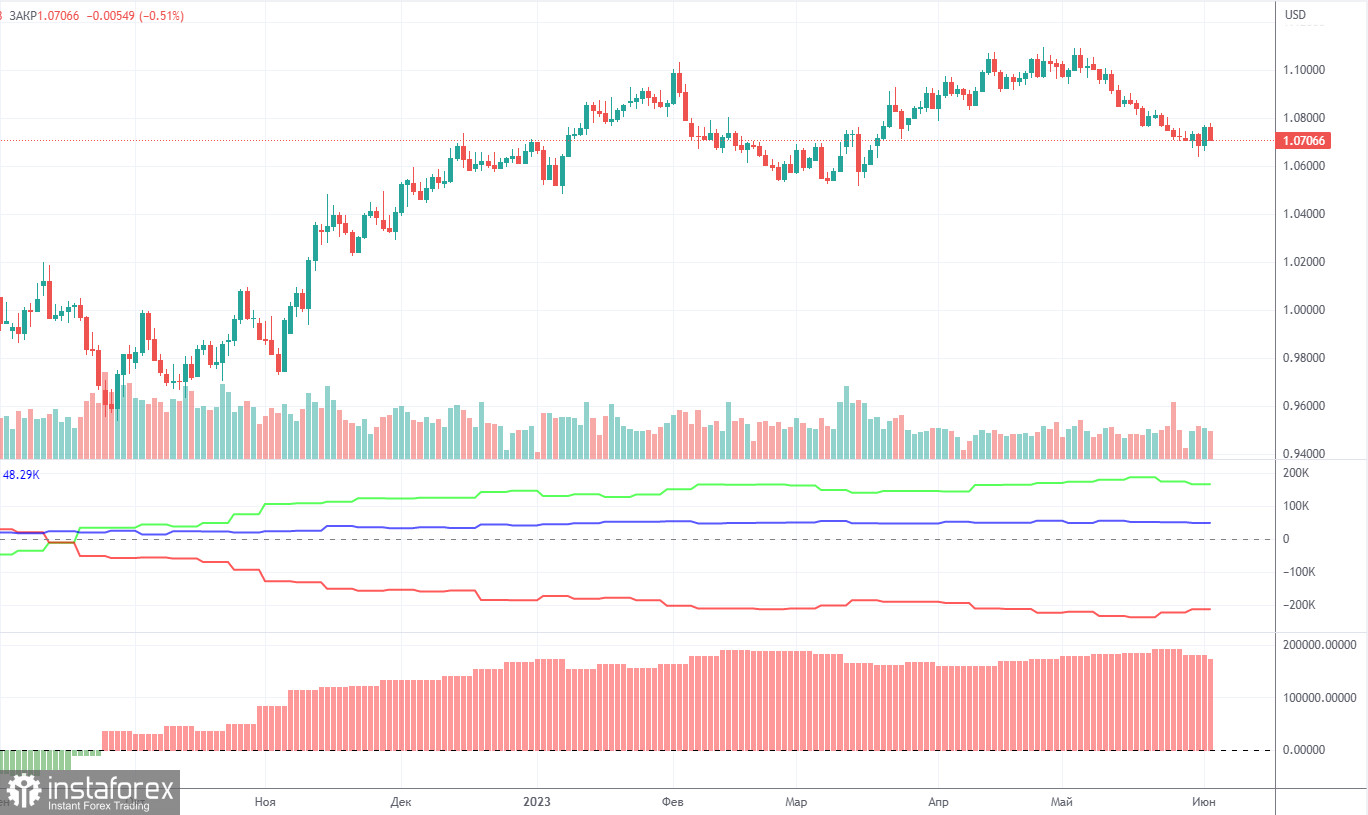
The COT report for May 30 was delivered on Friday. Over the past nine months, COT data has been in line with developments in the market. The net position (second indicator on the chart) has been on the rise since September 2022. The euro started to show strength approximately at the same time. Currently, the net non-commercial position is bullish and keeps growing further. Likewise, the euro is bullish.
Notably, we may assume by the extremely bullish net position that the uptrend may soon stop. The first indicator shows that, and the red and green lines are far away from each other, which is usually a sign that the end of the trend might be nearing. The euro attempted to go down several months ago, but those were just minor pullbacks. In the reporting week, long positions of non-commercial traders decreased by 8,200 and short positions fell by 200. The net position dropped by 8,000. The number of long positions exceeds that of short ones by 165,000, a rather big gap. A correction or a new downtrend has started. So, it is clear that the pair will be bearish even without COT reports.
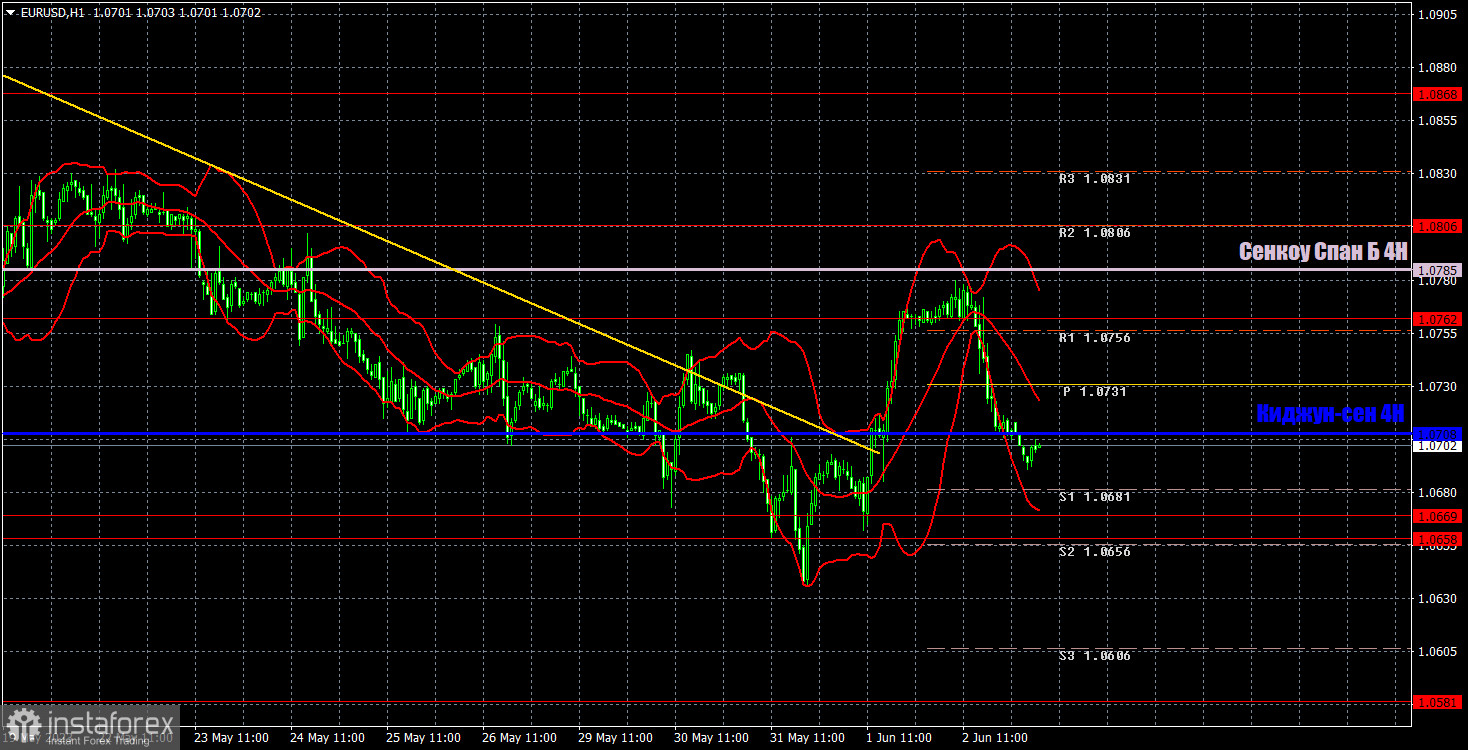
In the 1-hour time frame, the pair surpassed the descending trendline again, clearly indicating its intention to form an uptrend. This should be a correction, and afterwards the downward movement should resume. From a fundamental perspective, there are still no grounds for the pair to rise, but technically it may correct this week. However, the price is below the Ichimoku indicator lines again, so it may fall again.
On June 5, trading levels are seen at 1.0537, 1.0581, 1.0658-1.0669, 1.0762, 1.0806, 1.0868, 1.0943, 1.1092, as well as the Senkou Span B line (1.0785) and the Kijun-sen line (1.0708). Ichimoku indicator lines can move intraday, which should be taken into account when determining trading signals. There are also support and resistance although no signals are made near these levels. Signals could be made when the price either breaks or bounces from these extreme levels. Do not forget to place Stop Loss at the breakeven point when the price goes by 15 pips in the right direction. In case of a false breakout, it could save you from possible losses.
Today, both the EU and the US will release their respective Services PMIs for May. You should pay attention to the US ISM services, since it is more important than "ordinary" business activity indexes.
Resistance/support - thick red lines, near which the trend may stop. They do not make trading signals.
Kijun-sen and Senkou Span B are the Ichimoku indicator lines moved to the hourly timeframe from the 4-hour timeframe. They are also strong lines.
Extreme levels are thin red lines, from which the price used to bounce earlier. They can produce trading signals.
Yellow lines are trend lines, trend channels, and other technical patterns.
Indicator 1 on the COT chart is the size of the net position of each trader category.
Indicator 2 on the COT chart is the size of the net position for the Non-commercial group of traders.
InstaForex analytical reviews will make you fully aware of market trends! Being an InstaForex client, you are provided with a large number of free services for efficient trading.


