 Stay
Stay 
Trading Conditions
Products
Tools


On Friday, the GBP/USD pair fell after strong US data. The first half of the day saw a similar flat movement as the euro, while the second half witnessed a decline. However, the GBP/USD pair maintains an uptrend, with the price still above the Ichimoku indicator lines. Therefore, it could trade higher this week, despite the complete absence of fundamental and macroeconomic reasons for such a move. We still believe that both the pound and the euro should be falling. It is possible that they corrected last week so that it can continue moving downward.
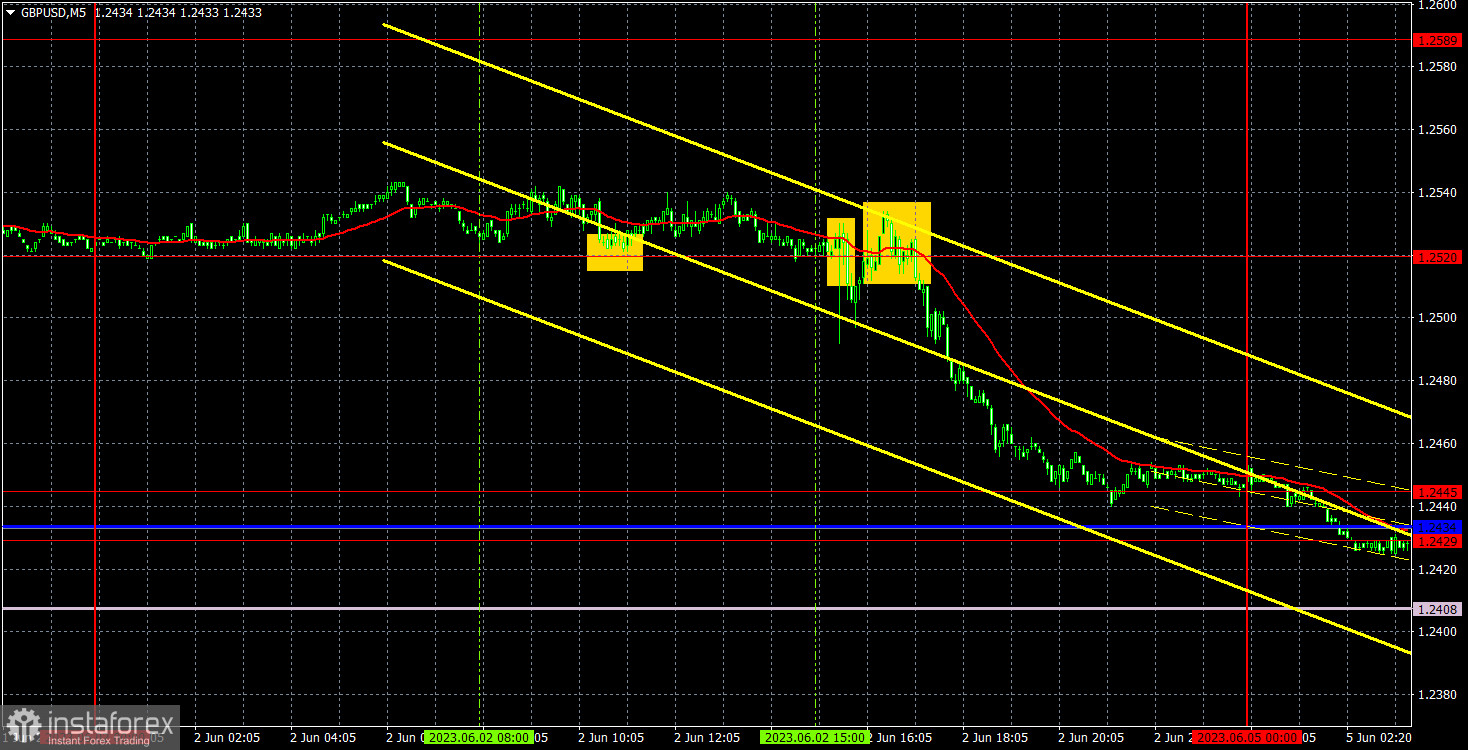
The trading signals for the pound were almost identical to those for the euro. During the European trading session, the price rebounded from the level of 1.2520 but failed to move in the right direction even by 20 pips. It was advisable to close the long position before the release of US data. Later, two sell signals formed near the same level, which traders could use to open a short position. Long positions were not recommended at that time as the reports clearly favored the dollar. Subsequently, the price dropped to the level of 1.2445, where the shorts should have been closed. The profit from them amounted to around 60 pips.
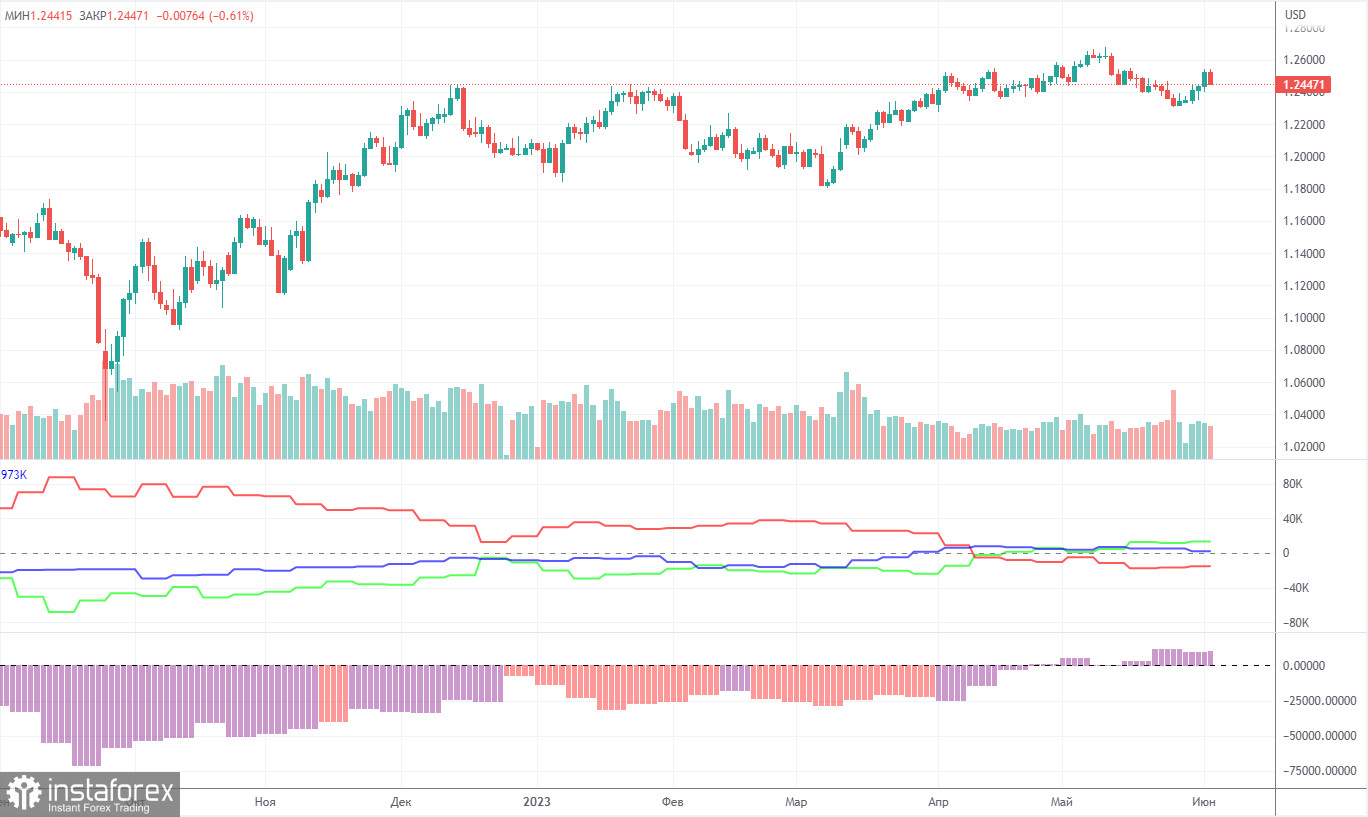
According to the latest report, non-commercial traders opened 1,100 long positions and closed 500 short ones. The net position increased by 600 and remained bullish. Over the past 9-10 months, the net position has been on the rise despite bearish sentiment. The pound is bullish against the greenback in the medium term, but there have been hardly any reasons for that. We assume that a prolonged bear run has begun. COT reports suggest a bullish continuation. However, we can hardly explain why the uptrend should go on.
Both major pairs are in correlation now. At the same time, the positive net position on EUR/USD shows the end of the uptrend. Meanwhile, the net position on GBP/USD is neutral. The pound has gained about 2,300 pips. Therefore, a bearish correction is now needed. Otherwise, a bullish continuation would make no sense even despite the lack of support from fundamental factors. Overall, non-commercial traders hold 57,000 sell positions and 70,300 long ones. We do not see the pair extending growth in the long term.
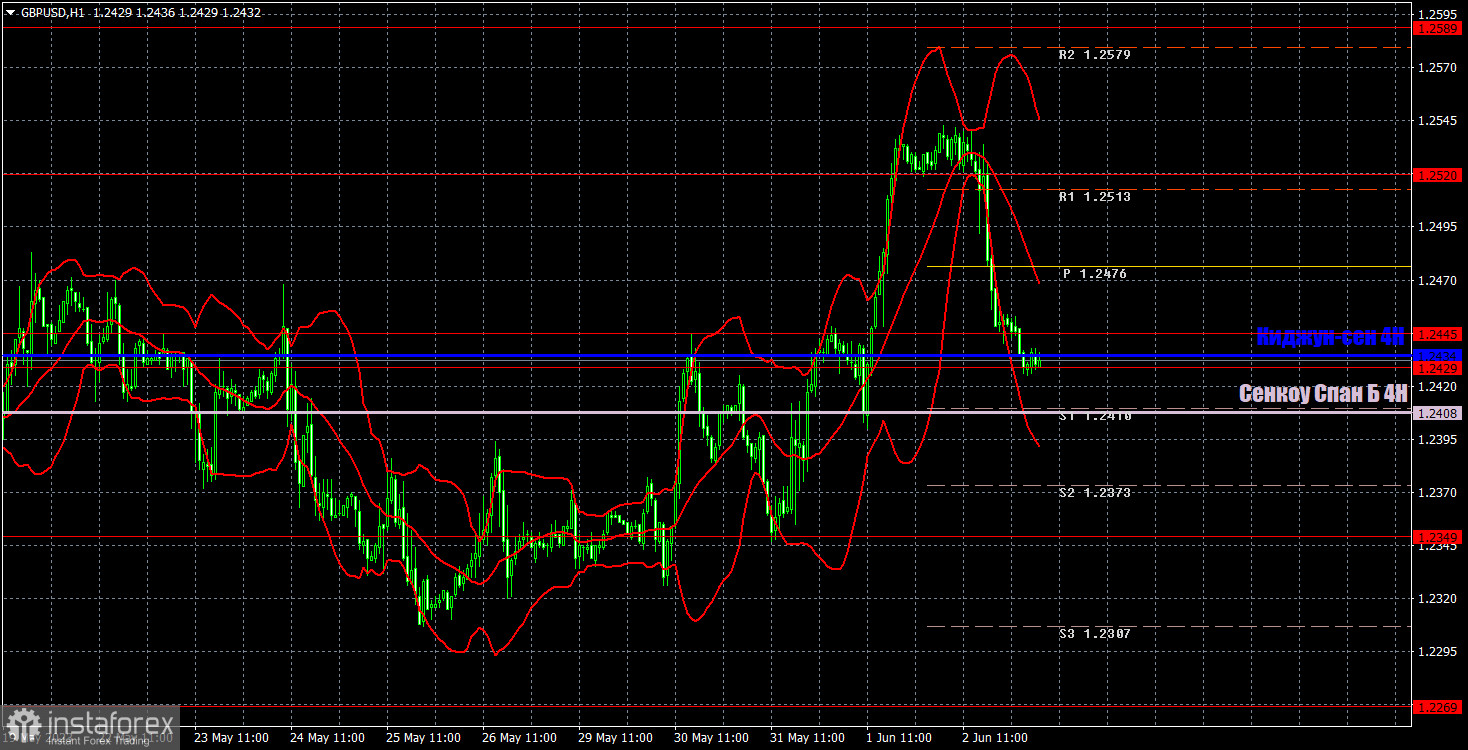
In the 1-hour time frame, the pair has started an upward movement, and even after Friday's decline, it remains above the Ichimoku indicator lines. The pound doesn't exactly have grounds to buy the pound, which remains heavily overbought. However, take note that the market has the right to trade regardless of the fundamental and macroeconomic backdrop. For now, let's consider that we have seen a strong correction last week and expect a revival of the downward movement.
On June 5, trading levels are seen at 1.2269, 1.2349, 1.2429-1.2445, 1.2520, 1.2589, 1.2666, 1.2762. The Senkou Span B line (1.2408) and the Kijun-sen line (1.2434) lines may also generate signals when the price either breaks or bounces off them. A Stop Loss should be placed at the breakeven point when the price goes 20 pips in the right direction. Ichimoku indicator lines can move intraday, which should be taken into account when determining trading signals. There are also support and resistance which can be used for locking in profits.
Today, both the UK and the US will release their respective Services PMIs for May. The UK data can influence traders' sentiment, as well as the US ISM data. Of course, it would be nice for the values of these data to deviate from the forecast, and the stronger the deviation, the stronger the market reaction may be.
Resistance/support - thick red lines, near which the trend may stop. They do not make trading signals.
The Kijun-sen and Senkou Span B lines are the Ichimoku indicator lines moved to the hourly timeframe from the 4-hour timeframe. They are also strong lines.
Extreme levels are thin red lines, from which the price used to bounce earlier. They can produce trading signals.
Yellow lines are trend lines, trend channels, and other technical patterns.
Indicator 1 on the COT chart is the size of the net position of each trader category.
Indicator 2 on the COT chart is the size of the net position for the Non-commercial group of traders.
InstaForex analytical reviews will make you fully aware of market trends! Being an InstaForex client, you are provided with a large number of free services for efficient trading.


