 Stay
Stay 
Trading Conditions
Products
Tools


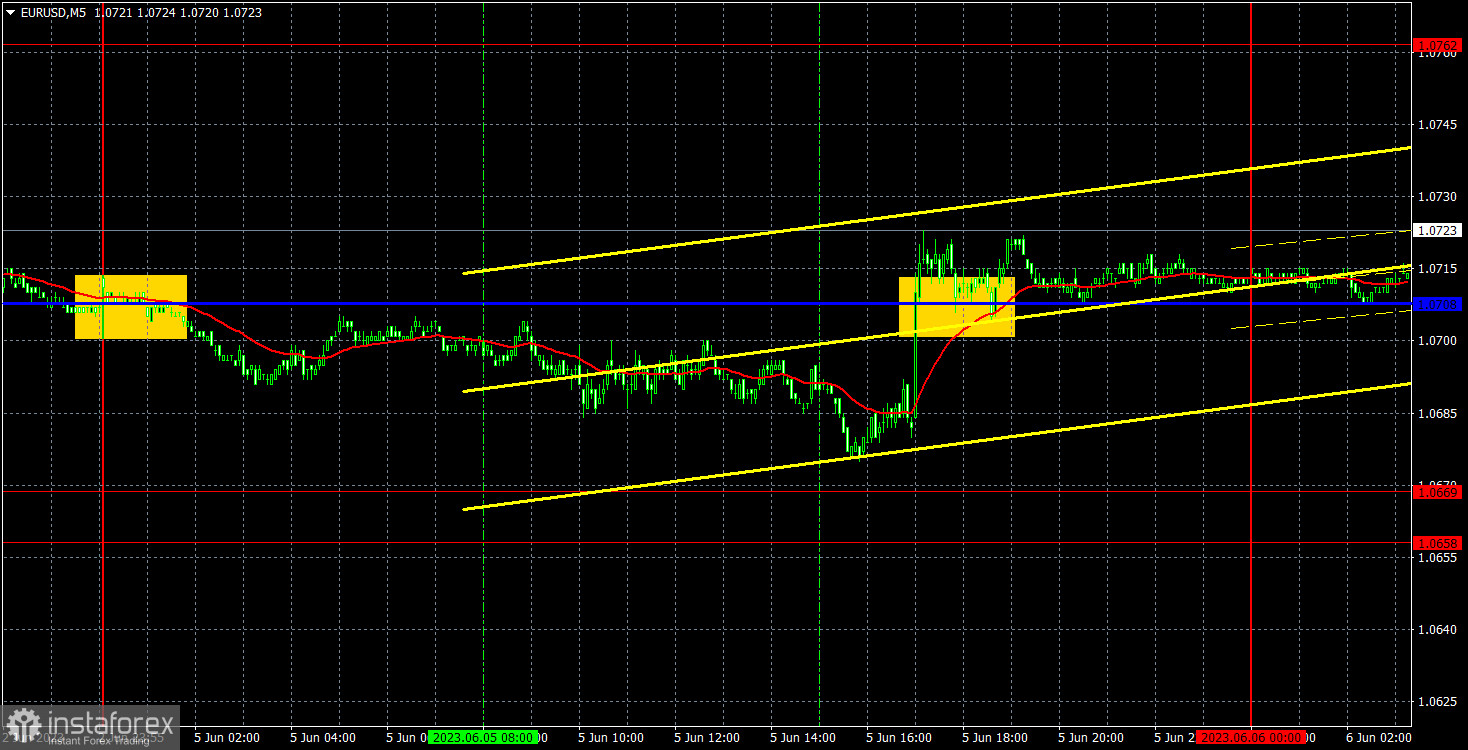
The EUR/USD pair extended its downward trajectory on Monday, which started last Friday. For a while, it seemed as though the pair was on track to revive last month's downtrend, which would have been logical. However, in the second half of the day, the US ISM services report was released, and it came in below expectations, teetering on the edge of falling below the "waterline" for May. As a result, the dollar sharply fell, although it wasn't exactly crucial. Volatility was quite low, just less than 50 pips. The pair managed to stay above the critical line, but the situation could still change. The problem is that there will be very few important events and reports this week.
There were only two trading signals in the past 24 hours. Overnight, the pair rebounded from the Kijun-sen line, and this signal could have been traded at the opening of the European trading session. However, the price did not reach the target level, so the trade likely closed at breakeven with the stop-loss. Subsequently, there was a buy signal near the same critical line, but the pair failed to move up even 20 pips.
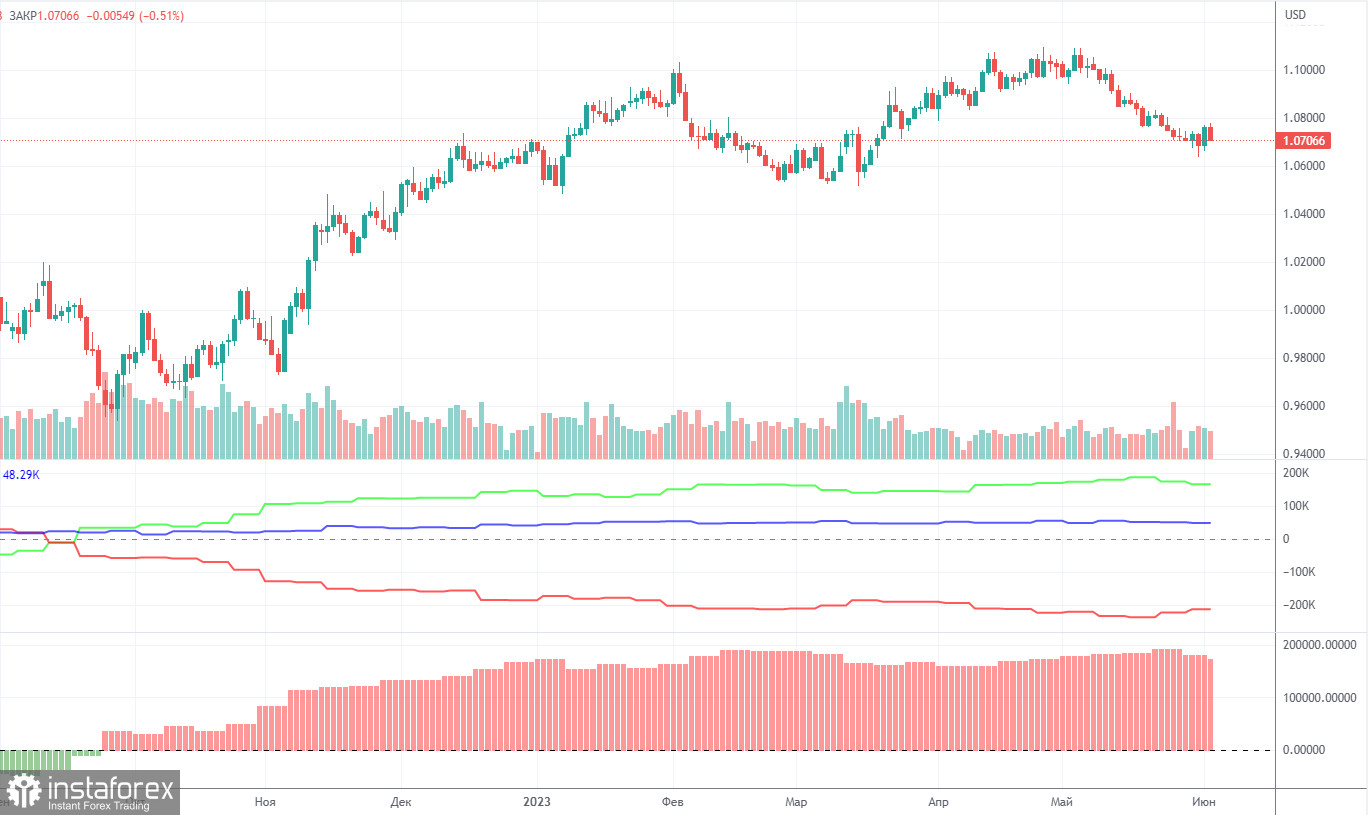
The COT report for May 30 was delivered on Friday. Over the past nine months, COT data has been in line with developments in the market. The net position (second indicator on the chart) has been on the rise since September 2022. The euro started to show strength approximately at the same time. Currently, the net non-commercial position is bullish and keeps growing further. Likewise, the euro is bullish.
Notably, we may assume by the extremely bullish net position that the uptrend may soon stop. The first indicator shows that, and the red and green lines are far away from each other, which is usually a sign that the end of the trend might be nearing. The euro attempted to go down several months ago, but those were just minor pullbacks. In the reporting week, long positions of non-commercial traders decreased by 8,200 and short positions fell by 200. The net position dropped by 8,000. The number of long positions exceeds that of short ones by 165,000, a rather big gap. A correction or a new downtrend has started. So, it is clear that the pair will be bearish even without COT reports.
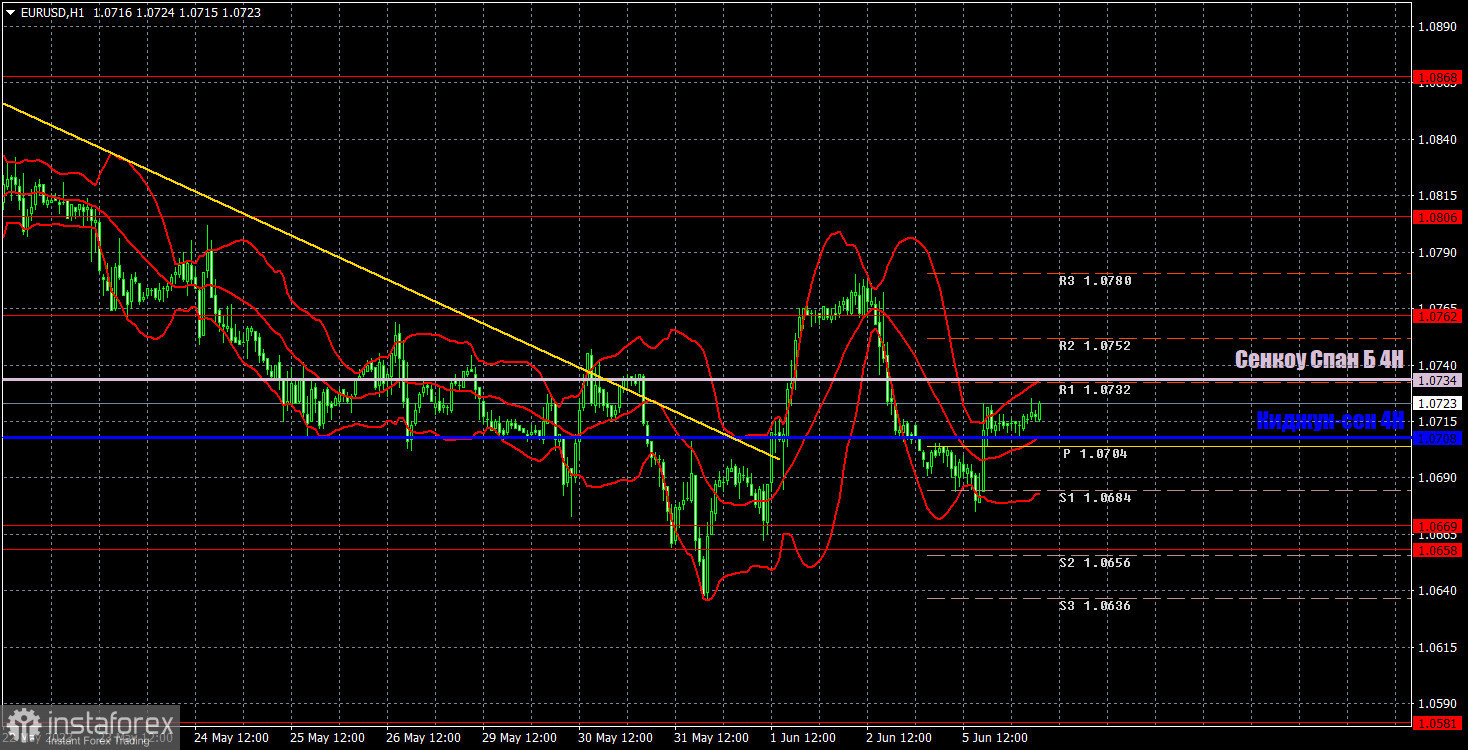
In the 1-hour time frame, the pair crossed the descending trendline for the second time, but it's not in a hurry to rise. The pair could enter a correction, but for now, the price remains below the Senkou Span B line. From a fundamental perspective, there are still no grounds for growth, but technically, it may enter a correction this week. We might observe a flat due to the weak fundamental and macroeconomic background this week.
On June 6, trading levels are seen at 1.0537, 1.0581, 1.0658-1.0669, 1.0762, 1.0806, 1.0868, 1.0943, 1.1092, as well as the Senkou Span B line (1.0734) and Kijun-sen line (1.0708). Ichimoku indicator lines can move intraday, which should be taken into account when determining trading signals. There are also support and resistance although no signals are made near these levels. Signals could be made when the price either breaks or bounces from these extreme levels. Do not forget to place Stop Loss at the breakeven point when the price goes by 15 pips in the right direction. In case of a false breakout, it could save you from possible losses.
Today, the eurozone will release its retail sales report, which is not particularly significant on its own. None scheduled for the US. Most likely, we can expect relatively weak movements and a lack of a clear trend today.
Resistance/support - thick red lines, near which the trend may stop. They do not make trading signals.
Kijun-sen and Senkou Span B are the Ichimoku indicator lines moved to the hourly timeframe from the 4-hour timeframe. They are also strong lines.
Extreme levels are thin red lines, from which the price used to bounce earlier. They can produce trading signals.
Yellow lines are trend lines, trend channels, and other technical patterns.
Indicator 1 on the COT chart is the size of the net position of each trader category.
Indicator 2 on the COT chart is the size of the net position for the Non-commercial group of traders.
InstaForex analytical reviews will make you fully aware of market trends! Being an InstaForex client, you are provided with a large number of free services for efficient trading.

