 Stay
Stay 
Trading Conditions
Products
Tools


Trend analysis (Fig. 1).
The market may move upward from the level of 1.0712 (closing of yesterday's daily candle) to test 1.0743, the 23.6% pullback level (red dotted line). Upon testing this level, a continued upward movement is possible with the target of 1.0785, the 21-day EMA (thin black line). And in the case of testing this level, the price may move down.
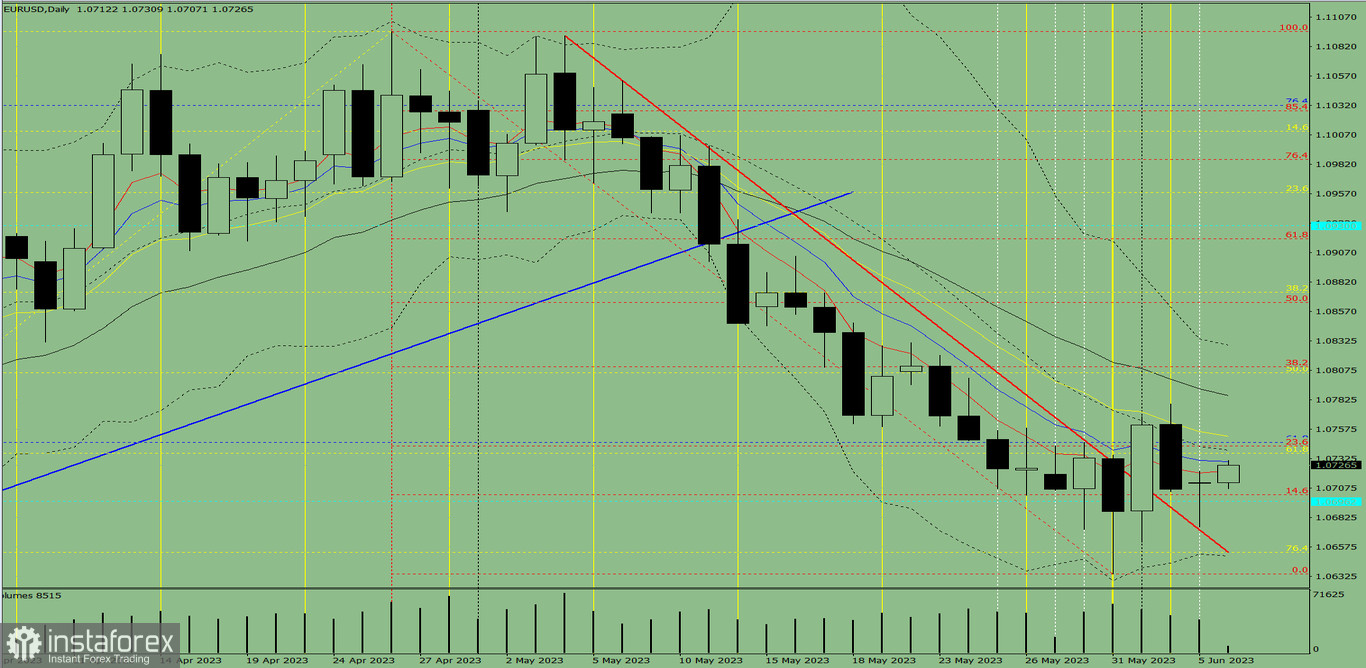
Fig. 1 (daily chart).
Comprehensive analysis:
General conclusion:
Today, the price may move upward from the level of 1.0712 (closing of yesterday's daily candle) to test 1.0743, the 23.6% pullback level (red dotted line). Upon testing this level, a continued upward movement is possible with the target of 1.0785, the 21-day EMA (thin black line). And in the case of testing this level, the price may move down.
Alternatively, the price may move upward from the level of 1.0712 (closing of yesterday's daily candle) to test 1.0743, the 23.6% pullback level (red dotted line). The price may decline from this level with the target of 1.0702, the 14.6% pullback level (red dotted line).
InstaForex analytical reviews will make you fully aware of market trends! Being an InstaForex client, you are provided with a large number of free services for efficient trading.


