 Stay
Stay 
Trading Conditions
Products
Tools


The GBP/USD pair traded lower on Tuesday. This is likely because there was no macroeconomic background for the day. In the morning, the UK released its PMI numbers, which turned out to be slightly better than expected. However, the pair started falling in the morning, so we arrived at the conclusion that the market ignored this report. The thing is, the numbers only slightly deviated from forecasts, which explains the market's reaction. There was nothing of interest in the US, so traders had nothing to react to throughout the day.
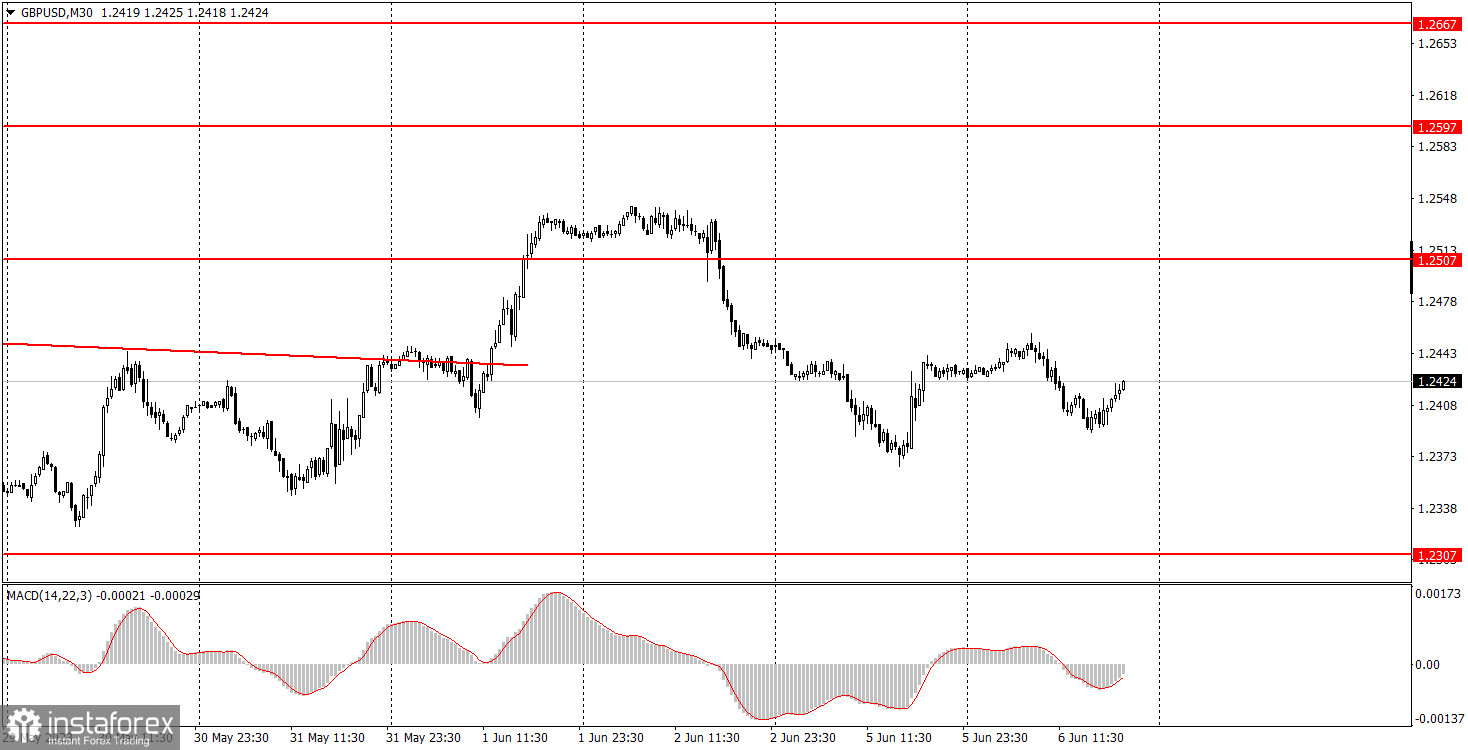
After breaking the second downward-sloping trendline, the pair didn't really rise either. On the first day after the breakthrough, the pair grew somewhat, but then again it has been falling or moving sideways for three consecutive days, more so than it has been rising. The situation is currently ambiguous, and the macroeconomic background is virtually nonexistent.
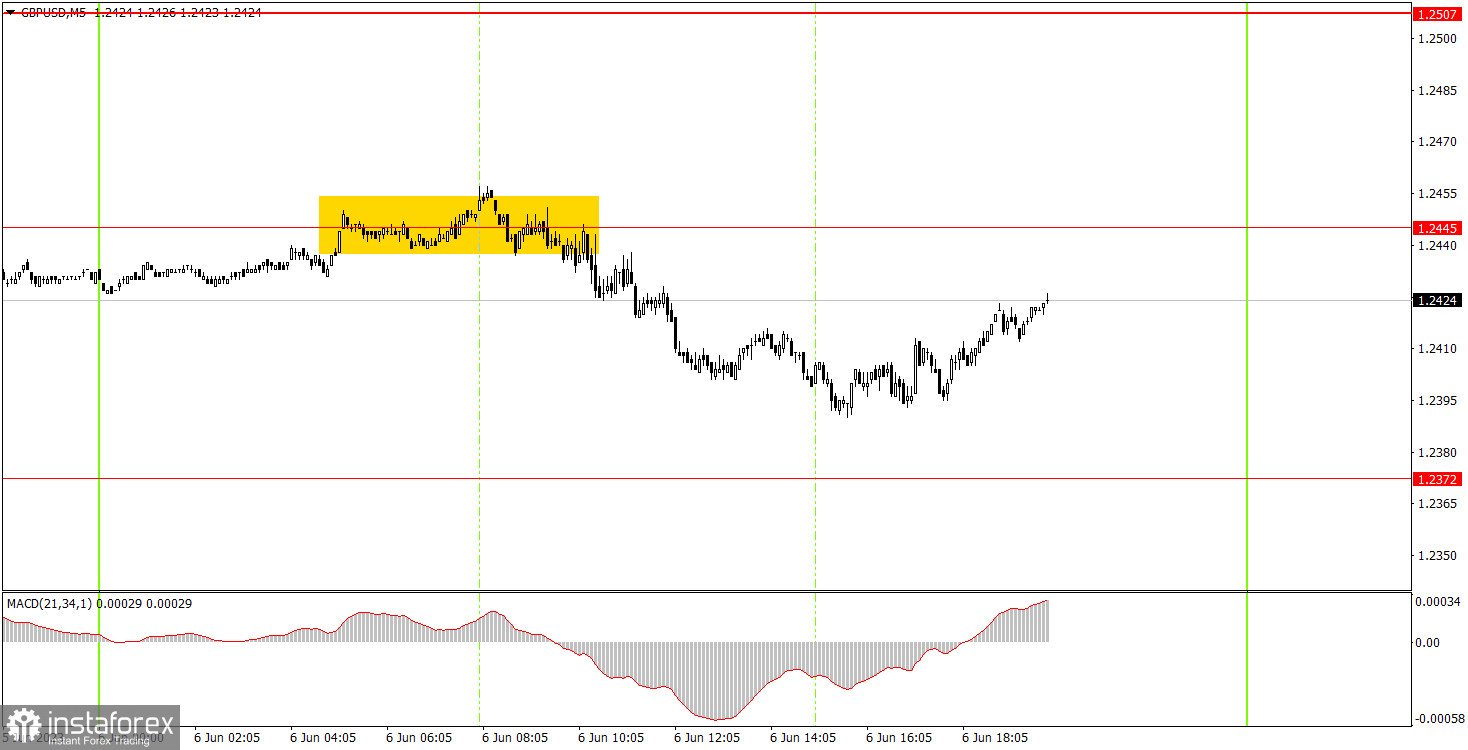
There was only one trading signal on the 5-minute chart. At the beginning of the European trading session, the pair rebounded from the 1.2445 level and then moved down by about 40 pips. However, it failed to reach its nearest target level at 1.2372. During the US trading session, the pair was rising, but sluggishly and reluctantly. Therefore, the only short position should have been manually closed closer to the evening. The profit from it was around 15-20 pips. Not the best movement throughout the day.
As seen on the 30M chart, the GBP/USD pair has ended its downtrend and started a new uptrend in the short-term. However, in reality, we haven't observed any significant upward movement yet. We believe that the pound has not fallen enough to form a new strong uptrend, so we're waiting for its decline. However, there will be relatively little important data this week, so we also recommend paying attention to higher charts. The key levels on the 5M chart are 1.2171-1.2179, 1.2245, 1.2307, 1.2372, 1.2445, 1.2507-1.2520, 1.2597-1.2616, 1.2659, 1.2697. When the price moves 20 pips in the right direction after opening a trade, a stop loss can be set at breakeven. There are no important events scheduled in the UK on Wednesday. The same goes for the US. Therefore, we expect predominantly sideways movement and low volatility from the pair.
1) The strength of the signal depends on the time period during which the signal was formed (a rebound or a break). The shorter this period, the stronger the signal.
2) If two or more trades were opened at some level following false signals, i.e. those signals that did not lead the price to Take Profit level or the nearest target levels, then any consequent signals near this level should be ignored.
3) During the flat trend, any currency pair may form a lot of false signals or do not produce any signals at all. In any case, the flat trend is not the best condition for trading.
4) Trades are opened in the time period between the beginning of the European session and until the middle of the American one when all deals should be closed manually.
5) We can pay attention to the MACD signals in the 30M time frame only if there is good volatility and a definite trend confirmed by a trend line or a trend channel.
6) If two key levels are too close to each other (about 5-15 pips), then this is a support or resistance area.
Take Profit levels near them.
Red lines are channels or trend lines that display the current trend and show which direction is better to trade.
MACD indicator (14,22,3) is a histogram and a signal line showing when it is better to enter the market when they cross. This indicator is better to be used in combination with trend channels or trend lines.
Important speeches and reports that are always reflected in the economic calendars can greatly influence the movement of a currency pair. Therefore, during such events, it is recommended to trade as carefully as possible or exit the market in order to avoid a sharp price reversal against the previous movement.
Beginners should remember that every trade cannot be profitable. The development of a reliable strategy and money management are the key to success in trading over a long period of time.
InstaForex analytical reviews will make you fully aware of market trends! Being an InstaForex client, you are provided with a large number of free services for efficient trading.


