 Stay
Stay 
Trading Conditions
Products
Tools


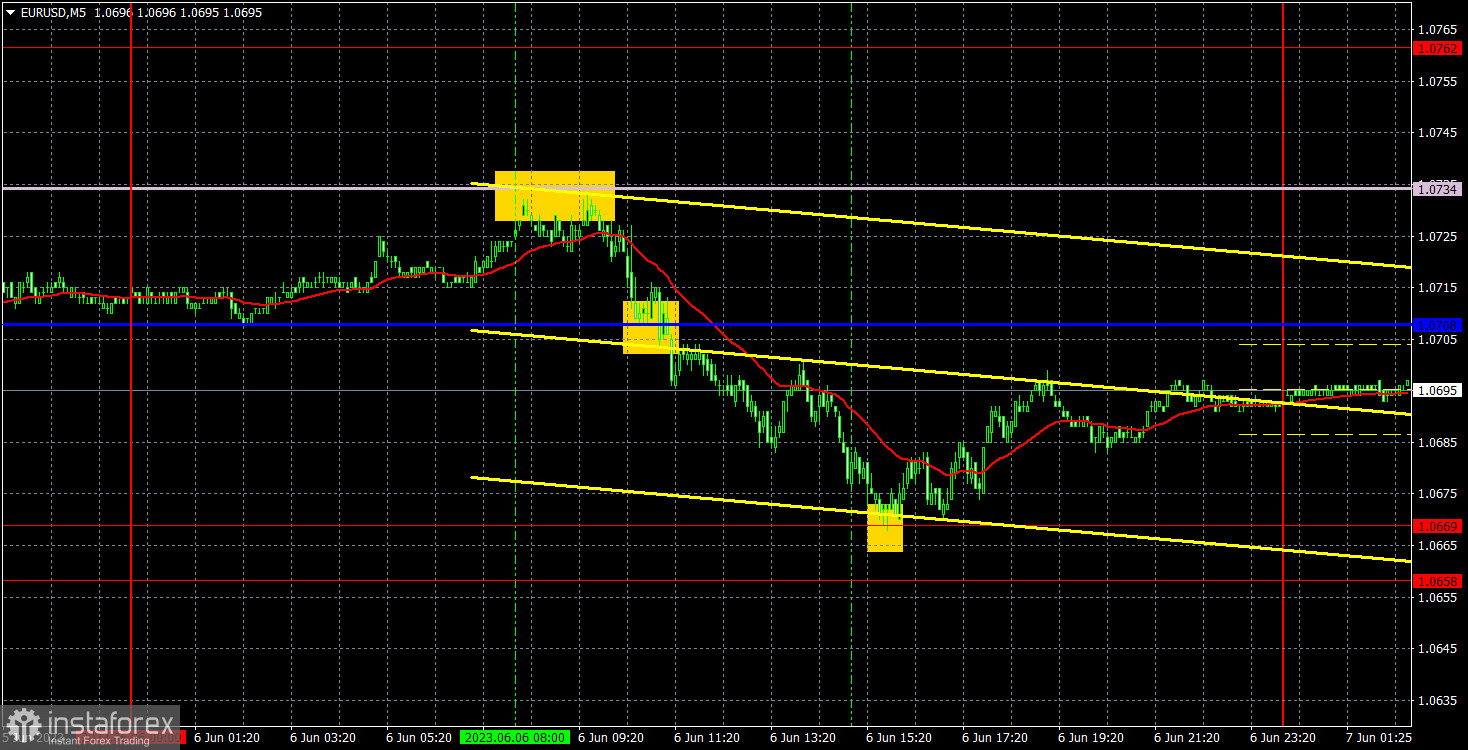
The EUR/USD pair declined slightly on Tuesday. The chart below clearly shows that given the Ichimoku indicator lines, the pair failed to rise above the key level. It means that the likelihood of a new decrease is high. It could also get stuck in a narrow range as the economic calendar is almost empty this week. The volatility has been dropping for several months in a row. Yesterday, there was only one crucial report – retail sales data for the eurozone. This report turned out to be slightly worse than forecasts but markets did not react to it in any way. The movements of the pair during the day were in line with technical indicators.
As for trading signals, they were clear on Tuesday. The pair bounced off the Senkou Span B line and broke through the target level line. After that, it retreated from 1.0669. All three signals were quite accurate and profitable. Thus, traders could first open a short position, lock in profits near 1.0669 and open a long position. Both positions turned out to be profitable. Speculators managed to earn about 40 pips on short positions and 15 pips on long ones.
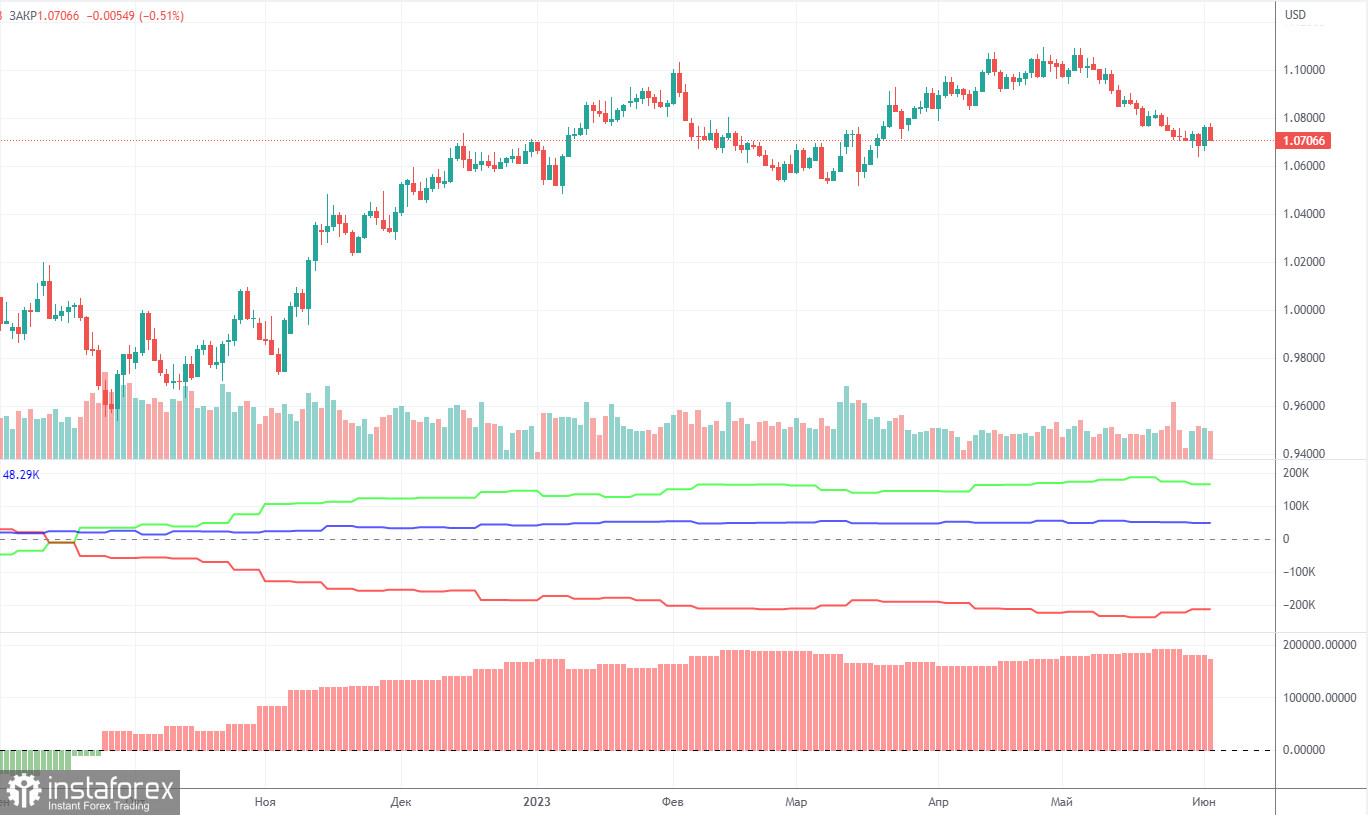
On Friday, a new COT report for May 30 was released. In the last 9 months, COT reports have fully corresponded to what is happening on the market. The chart above clearly shows that the net position of big traders (the second indicator) began to grow again in September 2022. At the same time, the euro resumed an upward movement. The net position of non-commercial traders is bullish. The euro is trading at its highs against the US dollar.
I have already mentioned that a fairly high value of the "net position" indicates the end of the uptrend. The first indicator also signals such a possibility as the red and green lines are very far from each other. It often occurs before the end of the trend. The euro tried to start falling a few months ago but there was only a pullback. During the last reporting week, the number of long positions of the "Non-commercial" group of traders decreased by 8,200, and the number of short positions – by 200. The net position tumbled by 8,000. The number of long positions is higher than the number of short ones. Non-commercial traders opened 165,000 long positions. This is a very large gap. The difference is more than three times. The correction has begun. Yet, it may not be a correction but the start of a new downtrend. At this time, it is clear that the pair is likely to resume a downward movement without COT reports.
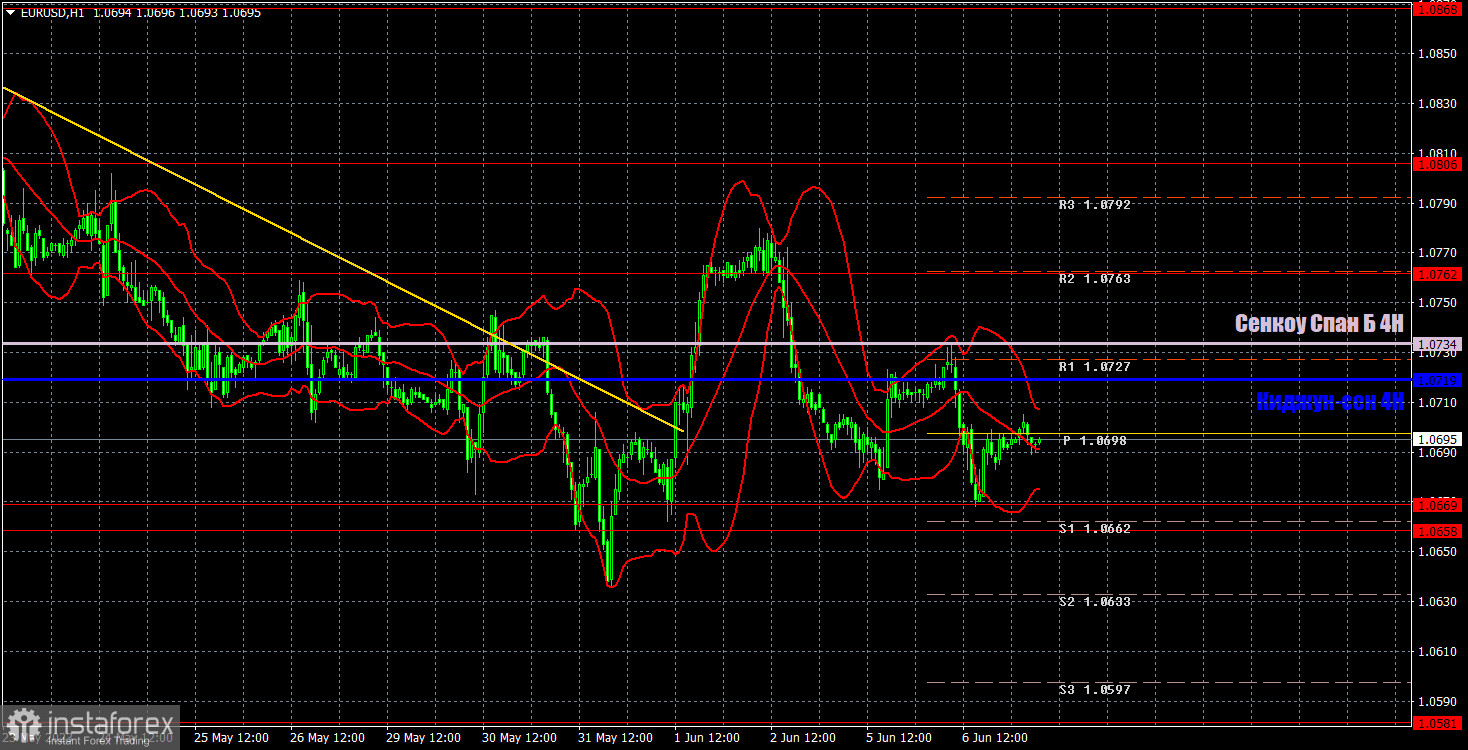
On the 1H, the pair broke through the descending trend line for the second time. However, it has not climbed from this line yet. A correction is possible. Currently, the price is located below the Senkou Span B and Kijun-sen lines. The pair still has no drivers for growth. Technically, it may continue to adjust this week. Due to the weak fundamental background, the pair could slide into a narrow range.
On June 7, one should pay attention to the following levels: 1.0537, 1.0581, 1.0658-1.0669, 1.0762, 1.0806, 1.0868, 1.0943, 1.1092 as well as the Senkou Span B (1.0734) and Kijun-sen (1.0719) lines. The lines of the Ichimoku indicator can move during the day. Bear it in mind when determining trading signals. There are also support and resistance levels but they do not provide signals, e.g. bounces or breakouts from extreme levels and lines. Do not forget about placing a Stop Loss order at breakeven if the price moves in the right direction by 15 pips. It will you avoid losses if the signal turns out to be false.
Today, ECB Vice President Luis de Guindos will make a speech. The economic calendar for the US is empty. Guindos could give more clues about future plans for monetary policy. However, this is just an assumption. This is why trading on Wednesday is likely to be sluggish.
What's on charts:
Support and resistance levels (resistance /support) are thick red lines near which the trend may end. They do not provide trading signals.
The Kijun-sen and Senkou Span B lines are the lines of the Ichimoku indicator plotted to the H1 chart from the 4H one. They are strong lines.
Extreme levels are thin red lines from which the price bounced earlier. They provide trading signals.
Yellow lines are trend lines, trend channels, and any other technical patterns.
Indicator 1 on the COT charts is the net position size of each category of traders.
Indicator 2 on the COT charts is the net position size for the "Non-commercial" group of traders.
InstaForex analytical reviews will make you fully aware of market trends! Being an InstaForex client, you are provided with a large number of free services for efficient trading.

