 Stay
Stay 
Trading Conditions
Products
Tools


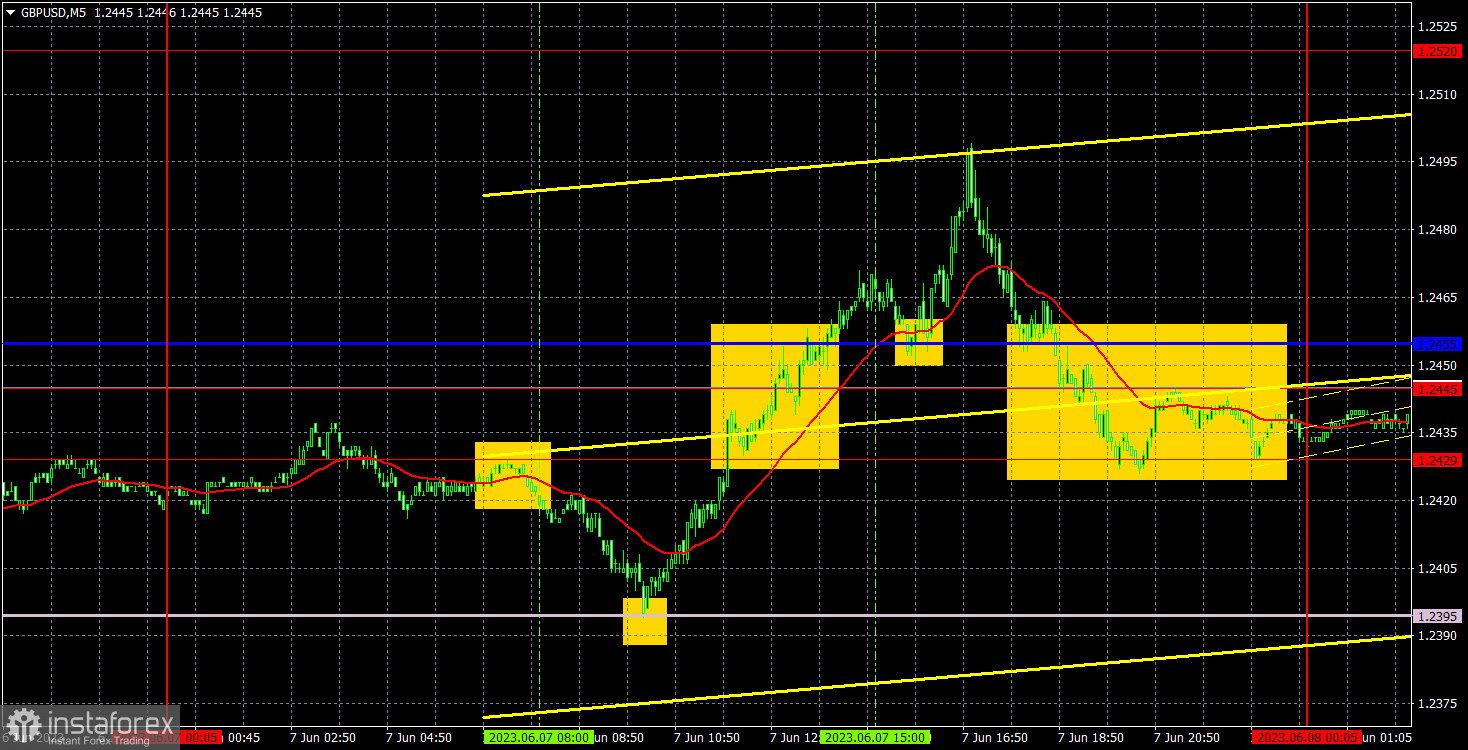
GBP/USD tried to resume its downward trajectory on Wednesday, but failed. It also made an initial attempt to rally, but the outcome was not very favorable either. Overall, the movement has a slight upward bias, but it is minimal. There were no significant macroeconomic or fundamental events in the UK and the US yesterday, yet the pair continued to exhibit noise and volatility almost out of nowhere. This is somewhat surprising, but the overall volatility remains relatively low. We still expect the pound to fall in the medium term.
However, there were many trading signals for strong movements. At the beginning of the European trading session, the pair rebounded from 1.2429 and then dropped to the Senkou Span B. Traders could have earned about 10 pips on this trade. The bounce from the Senkou Span B should have been traded with a long position, and the price subsequently surpassed all nearest levels and lines. There were no succeeding sell signals until the evening, so long positions should have been closed at any position closer to the evening. It was best to do this above the critical line, which guaranteed a profit of at least 55-60 pips. The profit is usually high when there is a strong movement.
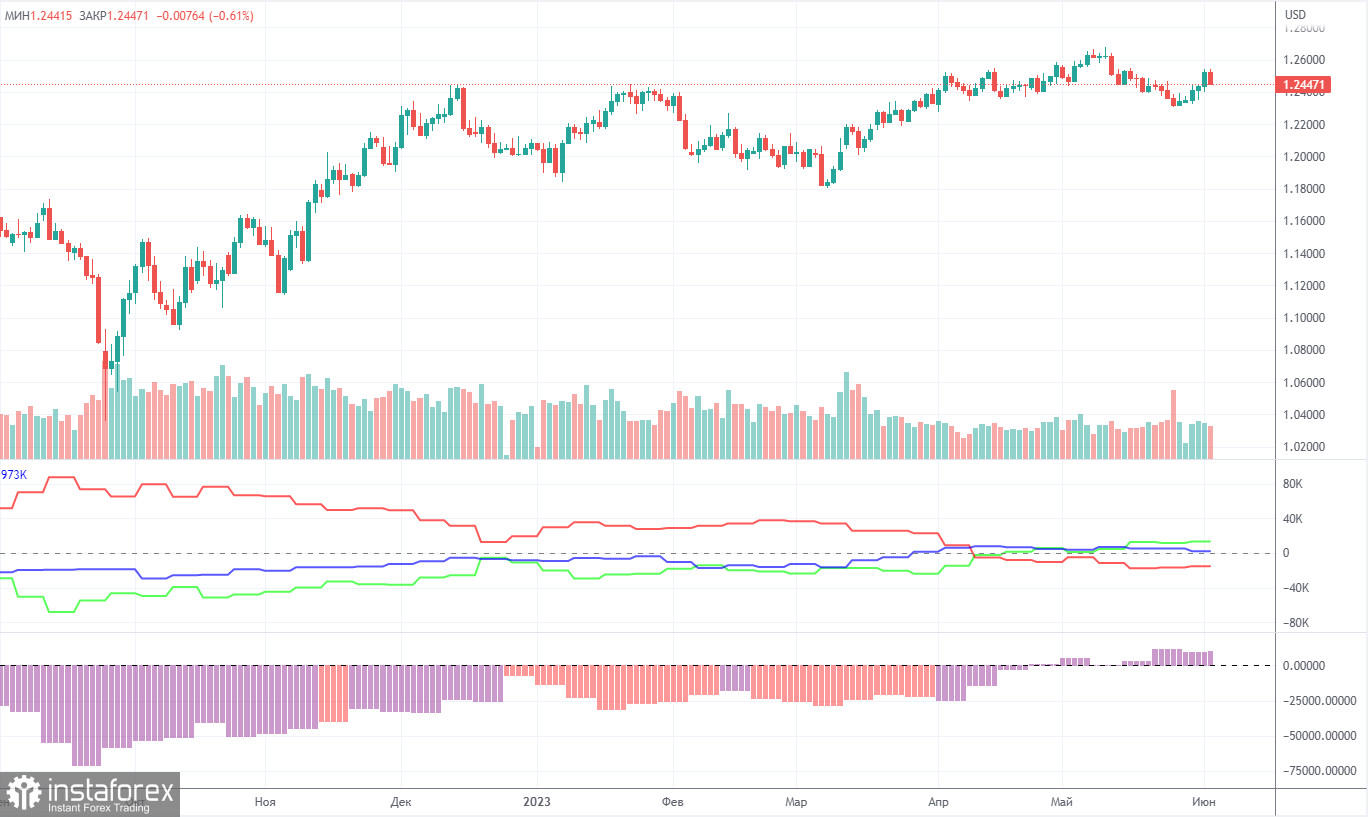
According to the latest report, non-commercial traders opened 1,100 long positions and closed 500 short ones. The net position increased by 600 and remained bullish. Over the past 9-10 months, the net position has been on the rise despite bearish sentiment. The pound is bullish against the greenback in the medium term, but there have been hardly any reasons for that. We assume that a prolonged bear run has begun. COT reports suggest a bullish continuation. However, we can hardly explain why the uptrend should go on.
Both major pairs are in correlation now. At the same time, the positive net position on EUR/USD shows the end of the uptrend. Meanwhile, the net position on GBP/USD is neutral. The pound has gained about 2,300 pips. Therefore, a bearish correction is now needed. Otherwise, a bullish continuation would make no sense even despite the lack of support from fundamental factors. Overall, non-commercial traders hold 57,000 sell positions and 70,300 long ones. We do not see the pair extending growth in the long term.
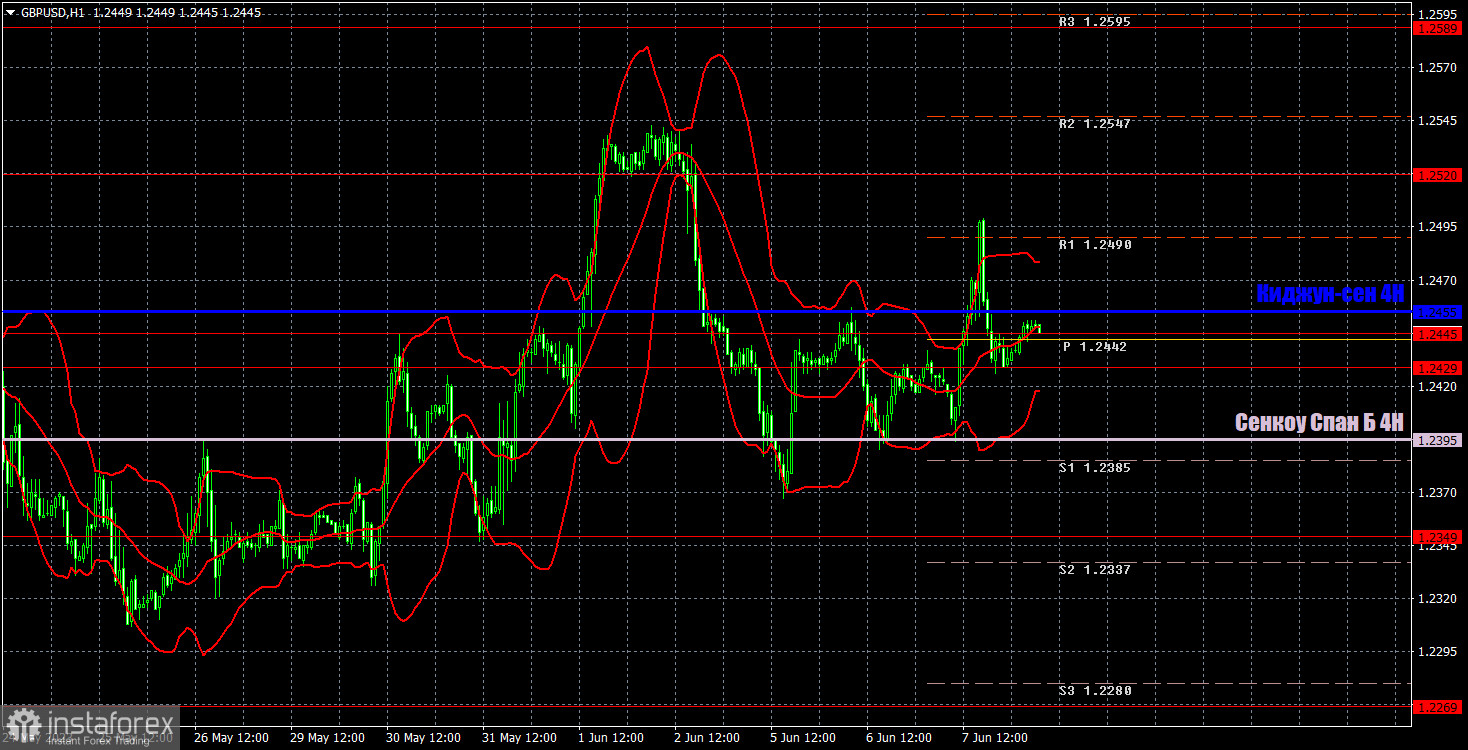
In the 1-hour time frame, the pair is trying to start an upward movement, but it is not going too well at the moment. We don't know why the market insists on buying the pound, which remains significantly overbought and unjustifiably high. However, keep in mind that the market has the right to trade regardless of the fundamental and macroeconomic backdrop. For now, we will consider this as a correction and expect a revival of the downward movement.
On June 8, trading levels are seen at 1.2269, 1.2349, 1.2429-1.2445, 1.2520, 1.2589, 1.2666, 1.2762. The Senkou Span B line (1.2395) and the Kijun-sen (1.2455) lines may also generate signals when the price either breaks or bounces off them. A Stop Loss should be placed at the breakeven point when the price goes 20 pips in the right direction. Ichimoku indicator lines can move intraday, which should be taken into account when determining trading signals. There are also support and resistance which can be used for locking in profits.
On Thursday, there are no significant events lined up in the UK or the US. The US unemployment claims report isn't considered "highly important". Therefore, today we can expect another flat, sideways movement, and low volatility. Yesterday's relatively good movements appear to be coincidental.
Resistance/support - thick red lines, near which the trend may stop. They do not make trading signals.
The Kijun-sen and Senkou Span B lines are the Ichimoku indicator lines moved to the hourly timeframe from the 4-hour timeframe. They are also strong lines.
Extreme levels are thin red lines, from which the price used to bounce earlier. They can produce trading signals.
Yellow lines are trend lines, trend channels, and other technical patterns.
Indicator 1 on the COT chart is the size of the net position of each trader category.
Indicator 2 on the COT chart is the size of the net position for the Non-commercial group of traders.
InstaForex analytical reviews will make you fully aware of market trends! Being an InstaForex client, you are provided with a large number of free services for efficient trading.


