 Stay
Stay 
Trading Conditions
Products
Tools


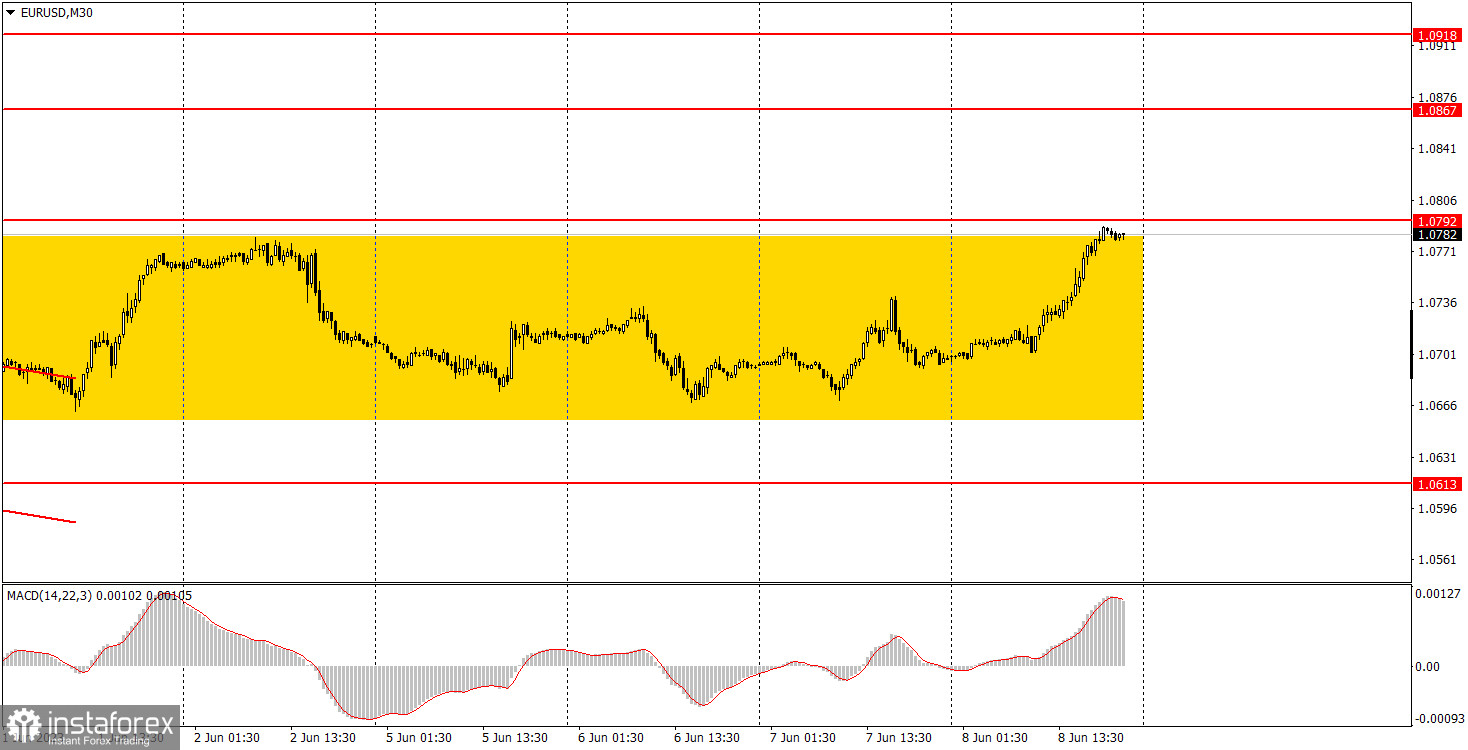
EUR/USD traded significantly higher on Thursday, specifically by 90 pips. However, despite the 90-pip increase, as shown in the chart above, the pair goes back and forth within the familiar range we have discussed in previous articles. The movements are random, making them nearly impossible to predict. For example, on Thursday, only two reports were published, which theoretically could have triggered a market reaction. Now, pay attention! The GDP report for the European Union in the first quarter unexpectedly came in worse than forecasts, showing a -0.1% quarterly decline. In other words, the market reaction should have been the opposite, but traders simply ignored the report, thus explaining the logic behind the movement. Since Thursday's rise was completely illogical, we may witness an equally unjustified decline on Friday.
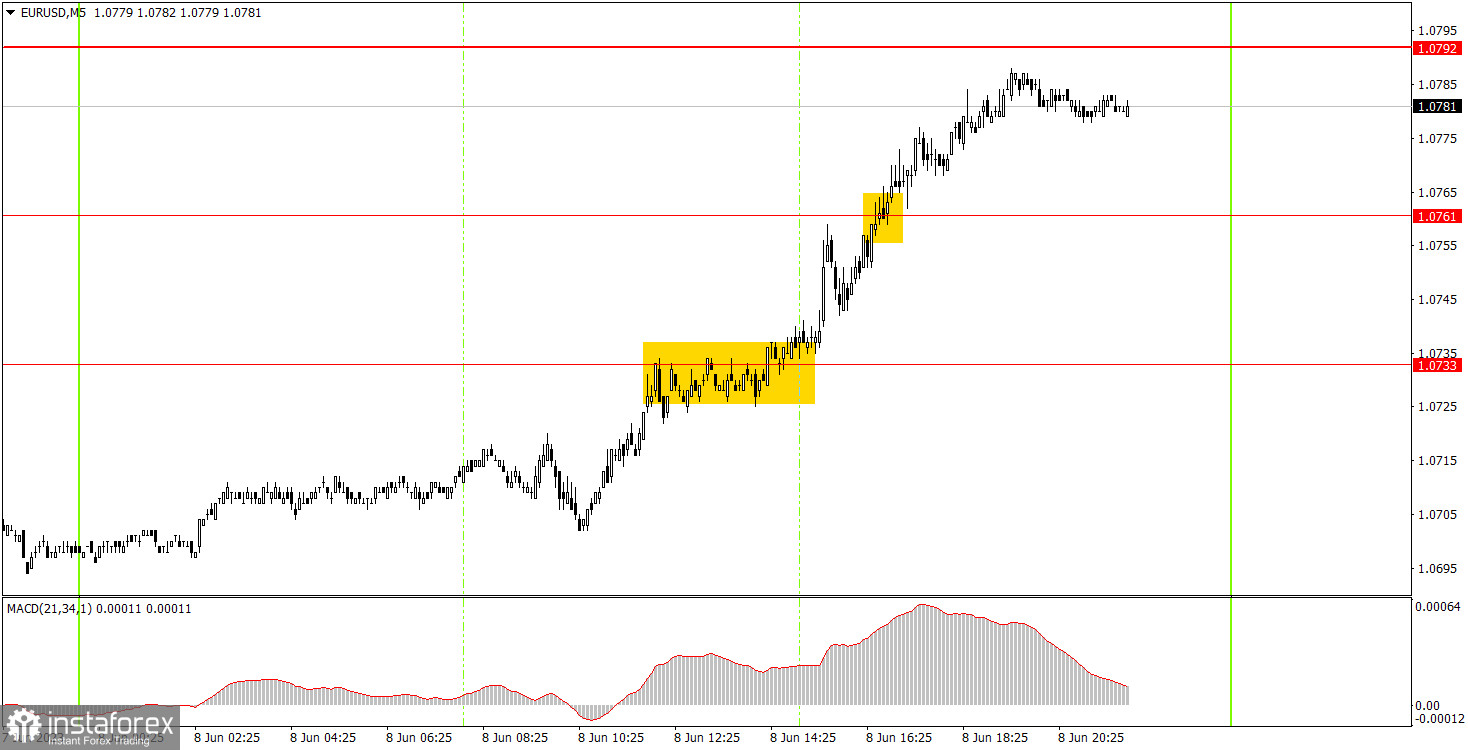
Two trading signals materialized on the 5-minute chart. Unfortunately, it was not possible to catch the very beginning of the movement, but the pair started rising overnight without any apparent reason. Thus, the first buy signal was formed around the level of 1.0733. Subsequently, the pair continued to rise and surpassed the level of 1.0761, almost reaching the level of 1.0792. Since no sell signals were formed during the day, long positions were manually closed in the evening, resulting in a profit of approximately 40 pips.
On the 30M chart, the pair indicates a slight inclination to terminate its descending trend, but for now, it is moving sideways more than up or down. In the medium term, we anticipate a resumption of the downward trend. However, it may take quite some time before the trend returns. If the pair surpasses the 1.0792 level, it may trade higher. The key levels on the 5M chart are 1.0517-1.0533, 1.0607-1.0613, 1.0673, 1.0733, 1.0761, 1.0792, 1.0857-1.0867, 1.0918-1.0933. A stop loss can be set at a breakeven point as soon as the price moves 15 pips in the right direction. On Friday, ECB VIce President Luis de Guindos is set to speak in the European Union, who has already delivered a speech this week. And that's all the important events for the last trading day of the week.
1) The strength of the signal depends on the time period during which the signal was formed (a rebound or a break). The shorter this period, the stronger the signal.
2) If two or more trades were opened at some level following false signals, i.e. those signals that did not lead the price to Take Profit level or the nearest target levels, then any consequent signals near this level should be ignored.
3) During the flat trend, any currency pair may form a lot of false signals or do not produce any signals at all. In any case, the flat trend is not the best condition for trading.
4) Trades are opened in the time period between the beginning of the European session and until the middle of the American one when all deals should be closed manually.
5) We can pay attention to the MACD signals in the 30M time frame only if there is good volatility and a definite trend confirmed by a trend line or a trend channel.
6) If two key levels are too close to each other (about 5-15 pips), then this is a support or resistance area.
Support and Resistance price levels can serve as targets when buying or selling. You can place Take Profit levels near them.
Red lines are channels or trend lines that display the current trend and show which direction is better to trade.
MACD indicator (14,22,3) is a histogram and a signal line showing when it is better to enter the market when they cross. This indicator is better to be used in combination with trend channels or trend lines.
Important speeches and reports that are always reflected in the economic calendars can greatly influence the movement of a currency pair. Therefore, during such events, it is recommended to trade as carefully as possible or exit the market in order to avoid a sharp price reversal against the previous movement.
Beginners should remember that every trade cannot be profitable. The development of a reliable strategy and money management are the key to success in trading over a long period of time.
InstaForex analytical reviews will make you fully aware of market trends! Being an InstaForex client, you are provided with a large number of free services for efficient trading.


