 Stay
Stay 
Trading Conditions
Products
Tools


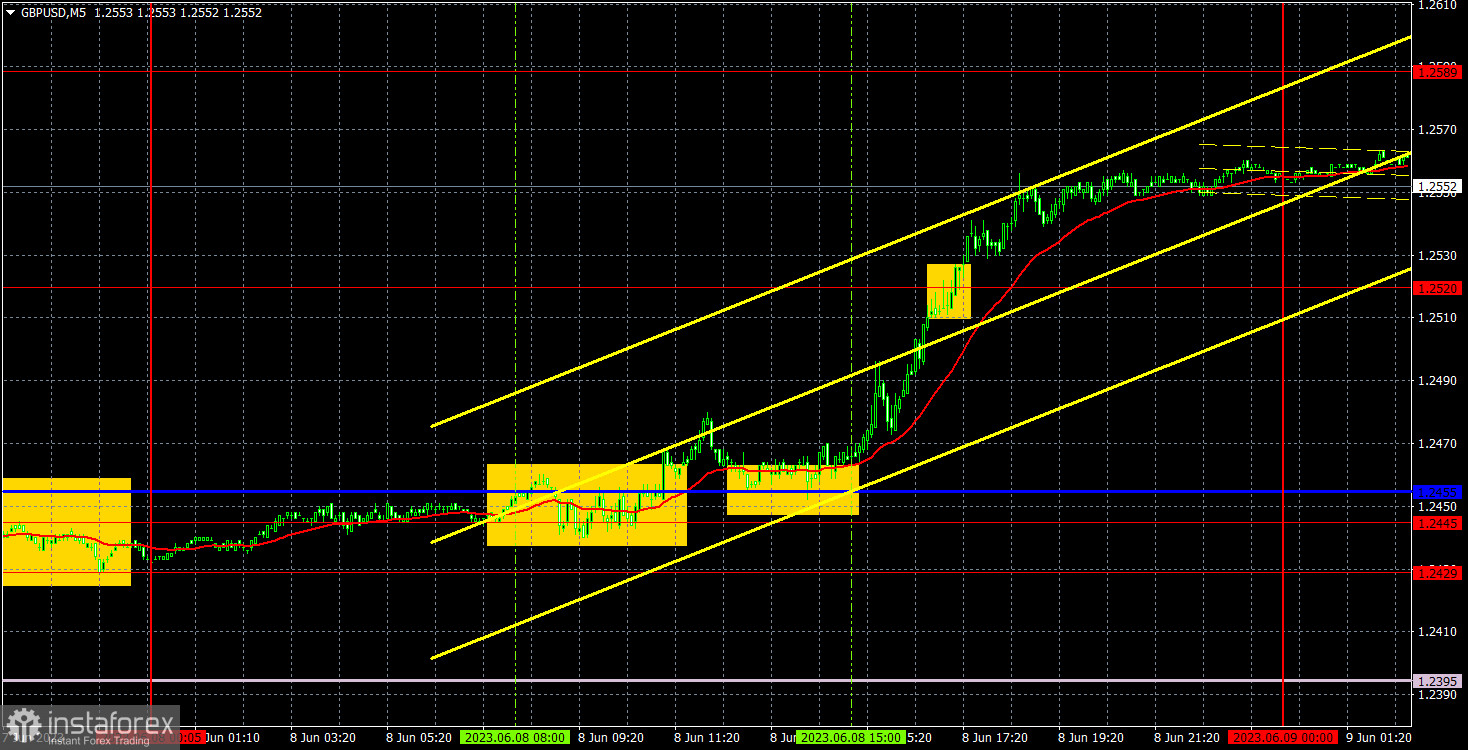
GBP/USD has been on an upward rebound path. As we previously mentioned, there were no grounds for the pound's growth or the dollar's fall on Thursday. The market simply decided to buy the pair and did so throughout the day. There was no news at all for the pound yesterday. In our fundamental articles, we tried to understand why the pound is rising now, but the upward movement still appears illogical. We're used to the pound's illogical growth in recent months, but each swing raises more questions.
During the European trading session, two buy signals were formed simultaneously, which confirmed each other and indicated the need to open a long position. The exchange rate continued to rise throughout the day, and the price climbed above the level of 1.2520 and continued to rise until the closing of the US session. Therefore, long positions should have been manually closed in the evening, resulting in a profit of at least 80 pips. Once again, we see that during strong trends, it is possible to earn a lot and relatively easily. It doesn't matter whether the pair moves logically or not.
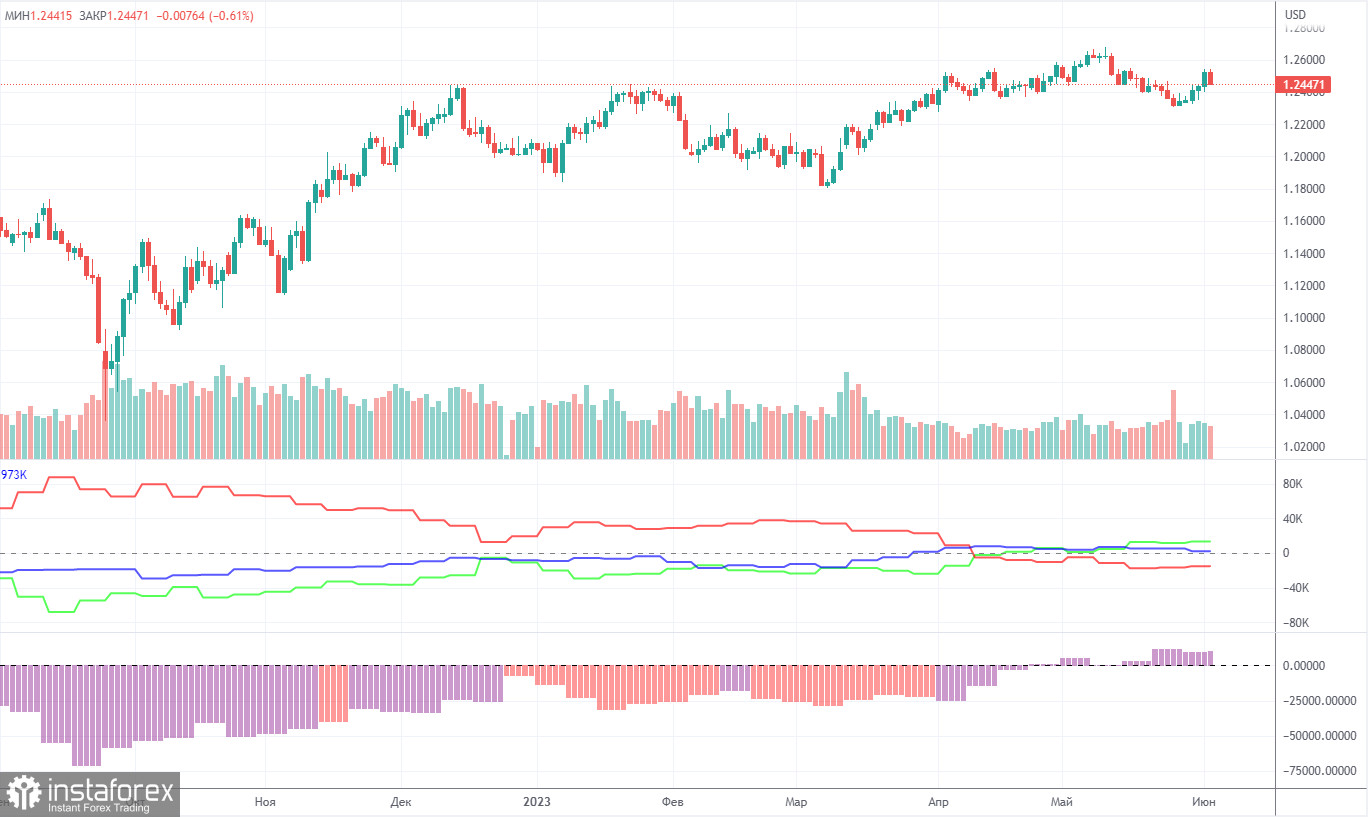
According to the latest report, non-commercial traders opened 1,100 long positions and closed 500 short ones. The net position increased by 600 and remained bullish. Over the past 9-10 months, the net position has been on the rise despite bearish sentiment. The pound is bullish against the greenback in the medium term, but there have been hardly any reasons for that. We assume that a prolonged bear run has begun. COT reports suggest a bullish continuation. However, we can hardly explain why the uptrend should go on.
Both major pairs are in correlation now. At the same time, the positive net position on EUR/USD shows the end of the uptrend. Meanwhile, the net position on GBP/USD is neutral. The pound has gained about 2,300 pips. Therefore, a bearish correction is now needed. Otherwise, a bullish continuation would make no sense even despite the lack of support from fundamental factors. Overall, non-commercial traders hold 57,000 sell positions and 70,300 long ones. We do not see the pair extending growth in the long term.
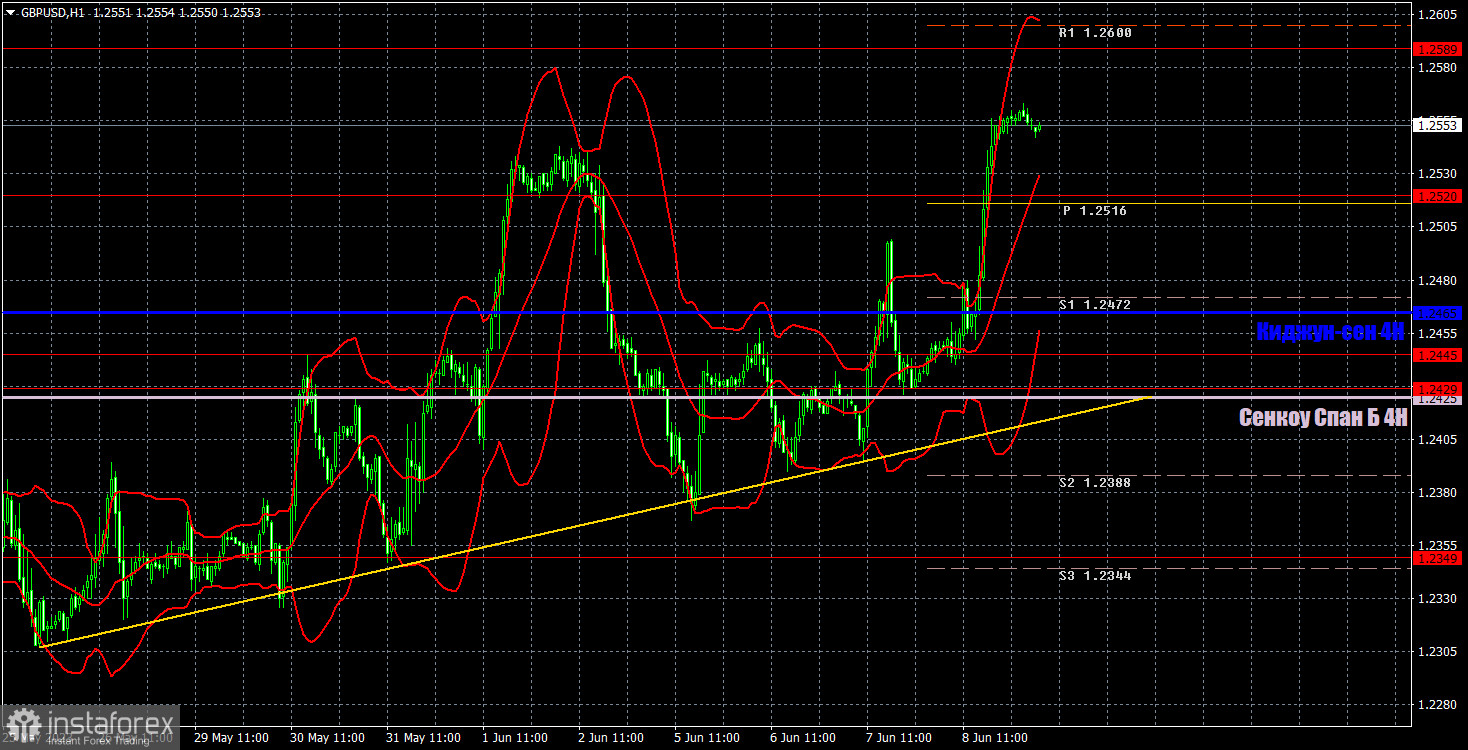
In the 1-hour chart, the pair continues to trade higher, but it does so in jerks and with long pauses. Currently, an upward trendline has formed, which supports the bulls, and the price is already above the Ichimoku indicator lines. Therefore, from a technical perspective, the growth appears logical. However, it is illogical from a fundamental and macroeconomic perspective. Nevertheless, for intraday trading, it is not very important to find out why the pair is rising or falling. The main thing is that we have movements that are strong and trend-driven.
On June 9, trading levels are seen at 1.2269, 1.2349, 1.2429-1.2445, 1.2520, 1.2589, 1.2666, 1.2762. The Senkou Span B (1.2425) and Kijun-sen (1.2465) lines may also generate signals when the price either breaks or bounces off them. A Stop Loss should be placed at the breakeven point when the price goes 20 pips in the right direction. Ichimoku indicator lines can move intraday, which should be taken into account when determining trading signals. There are also support and resistance which can be used for locking in profits.
There are no significant events lined up in the US and the UK. Since the pair showed strong and baseless growth yesterday, it could similarly collapse today. Moreover, in the past two weeks, the pair has been moving back and forth.
Resistance/support - thick red lines, near which the trend may stop. They do not make trading signals.
The Kijun-sen and Senkou Span B lines are the Ichimoku indicator lines moved to the hourly timeframe from the 4-hour timeframe. They are also strong lines.
Extreme levels are thin red lines, from which the price used to bounce earlier. They can produce trading signals.
Yellow lines are trend lines, trend channels, and other technical patterns.
Indicator 1 on the COT chart is the size of the net position of each trader category.
Indicator 2 on the COT chart is the size of the net position for the Non-commercial group of traders.
InstaForex analytical reviews will make you fully aware of market trends! Being an InstaForex client, you are provided with a large number of free services for efficient trading.


