 Stay
Stay 
Trading Conditions
Products
Tools


M5 chart of GBP/USD
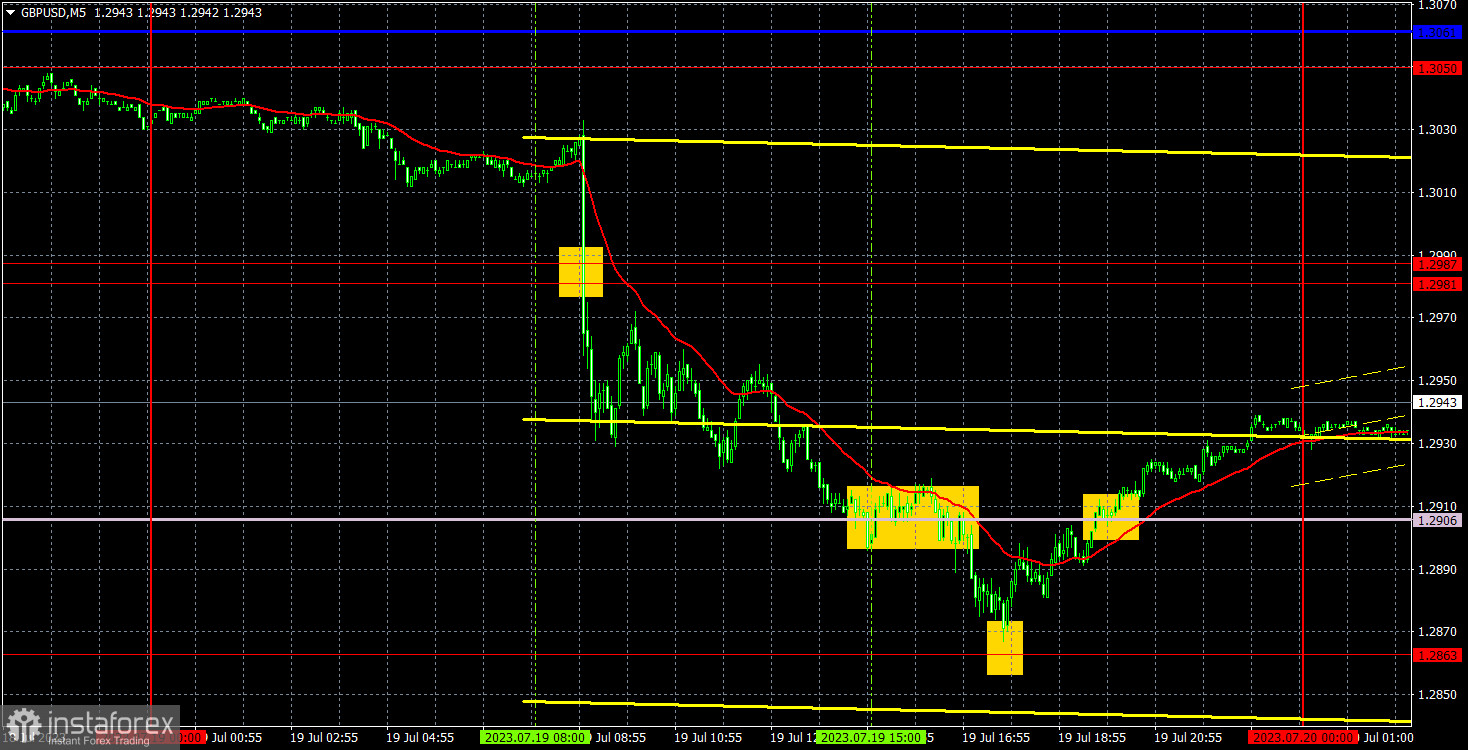
On Wednesday, GBP/USD plunged by 160 pips. It then slightly retraced up by the close of the day. Naturally, such a sharp fall was triggered by UK inflation because it missed market forecasts. In June, UK inflation slowed more than expected, meaning the Bank of England could change its stance on monetary policy later in 2023. Therefore, the pound's decrease in value was well justified. We feared an unexplained movement of the price and a surge in the sterling. However, everything went well yesterday, and the rest of the reports (from the US) were of little importance.
A few signals were generated yesterday. The first one came on a breakout through 1.2981-1.2987 after the publication of the inflation report. The price broke the Senkou Span B line and touched the level of 1.2863 where short positions were closed. That brought a profit of 85 pips. Another buy signal was made at around 1.2863, but the price barely bounced off it. Positions opened based on this signal brought some profit.
COT report:
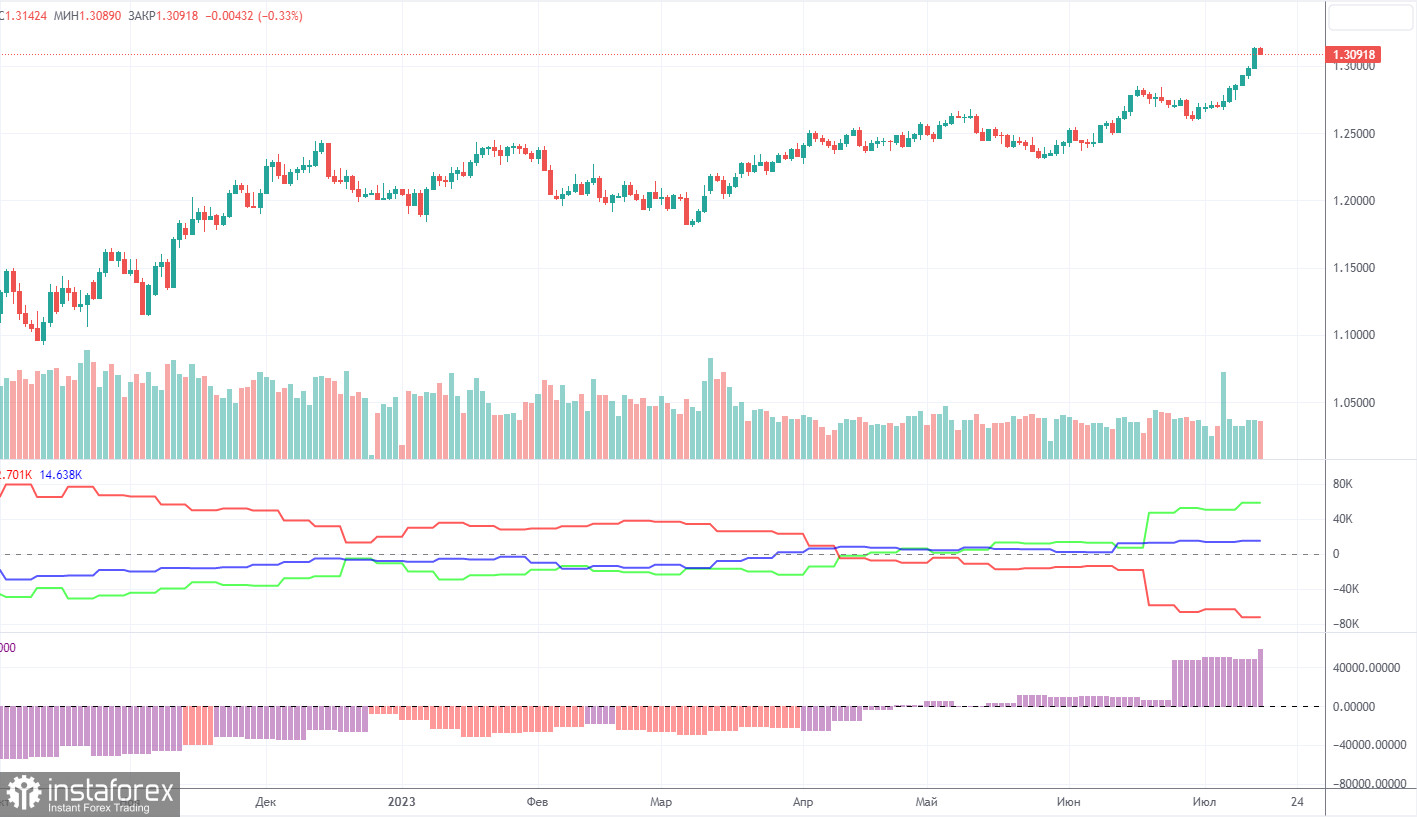
According to the latest COT report, non-commercial traders opened 15,200 long positions and 7,400 short positions. Over a week, the net non-commercial position has increased by 7,800 and is still rising. The net position has been bullish over 10 months as well as the pound sterling. It has grown so much that an uptrend continuation is unlikely. Therefore, the pound may enter a prolonged downtrend. Although COT reports assume the possibility of a slight increase in the pound, it seems hardly possible. It is difficult to explain why the market keeps buying out the currency. At the same time, there have been no technical sell signals either.
The pound has grown by 2,800 pips in total, which is an impressive rise. Without a strong bearish correction, a continuation of the uptrend will be hard to explain. However, the pair has moved without any reason for a long time now. Non-commercial traders now hold 111,600 long positions and 53,600 short ones. We doubt that the sterling will be bullish in the long term. However, the market is still buying it out, and the pair keeps ascending, a move similar to Bitcoin's.
H1chart of GBP/USD
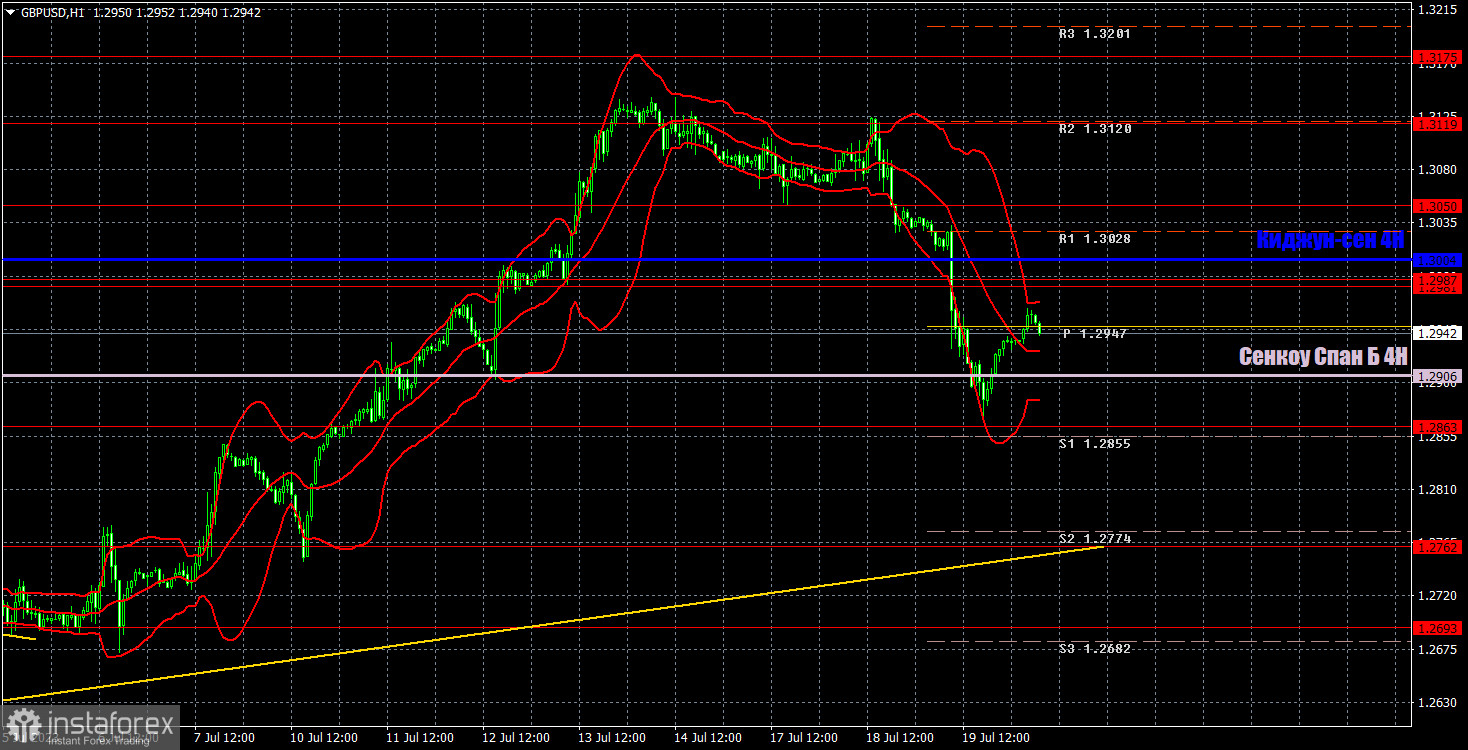
In the 1-hour time frame, GBP/USD is still in the uptrend. The pair consolidated below the key line, signaling the possibility of a correction. The market remains bullish because of the relevance of the ascending trendline. Moreover, the pair was unable to settle below the Senkou Span B for a long time. Therefore, growth may resume at any moment. If quotes consolidate below the Senkou Span B, we may see a fall to the trendline and count on a steeper decline.
On July 20, important levels are seen at 1.2693, 1.2762, 1.2863, 1.2981-1.2987, 1.3050, 1.3119, 1.3175, 1.3222, and 1.3273. The Senkou Span B (1.2906) and the Kijun-sen (1.3004) may also generate signals when the price either breaks or bounces off them. A Stop Loss should be placed at the breakeven point when the price goes 20 pips in the right direction. Ichimoku indicator lines can move intraday, which should be taken into account when determining trading signals. There are also support and resistance which can be used for locking in profits.
On Thursday, no important releases are due in the UK. The US will deliver a jobless claims report, which could draw the attention of the market only if figures miss expectations. Therefore, trading will be carried out based solely on technical factors today.
Indicators on charts:
Resistance/support - thick red lines, near which the trend may stop. They do not make trading signals.
The Kijun-sen and Senkou Span B lines are the Ichimoku indicator lines moved to the hourly timeframe from the 4-hour timeframe. They are also strong lines.
Extreme levels are thin red lines, from which the price used to bounce earlier. They can produce trading signals.
Yellow lines are trend lines, trend channels, and any other technical patterns.
Indicator 1 on the COT chart is the size of the net position of each trader category.
Indicator 2 on the COT chart is the size of the net position for the non-commercial traders.
InstaForex analytical reviews will make you fully aware of market trends! Being an InstaForex client, you are provided with a large number of free services for efficient trading.


