 Stay
Stay 
Trading Conditions
Products
Tools


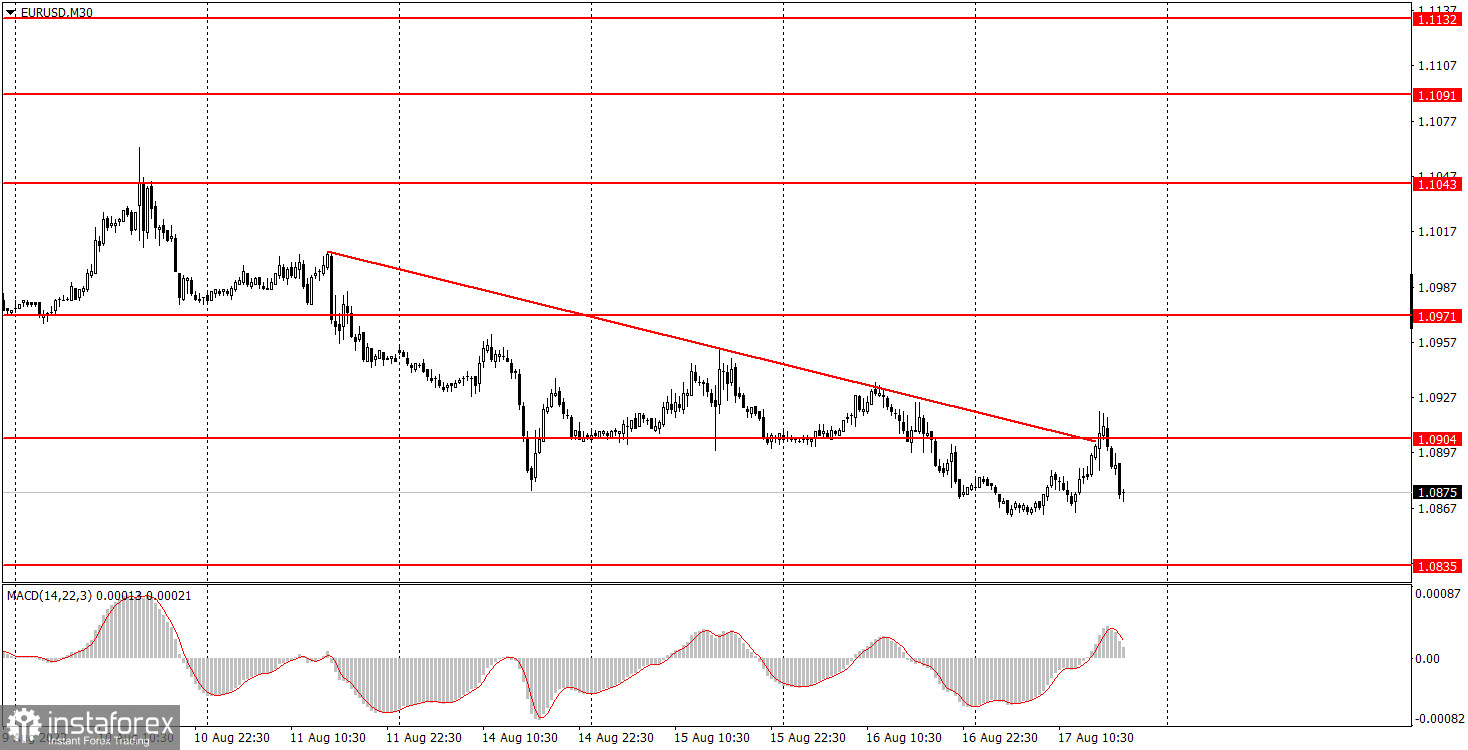
On Thursday, the EUR/USD lost ground. As we have repeatedly mentioned, the current downward movement is quite weak with frequent corrections and pullbacks to the upside. For instance, Thursday's volatility was 55 points, and it has averaged that much every day this week. It doesn't matter whether there was a macroeconomic and fundamental background or not. The pair simply trades with low volatility every day and gradually falls.
There was virtually no macroeconomic background on Thursday. No interesting event in the euro area, and the US only had the initial jobless claims report, which in its actual value almost entirely matched forecasts. Obviously, the dollar firming in the second half of the day is not related to this absolutely neutral report. Therefore, the euro continues to fall due to "bare" technical reasons.
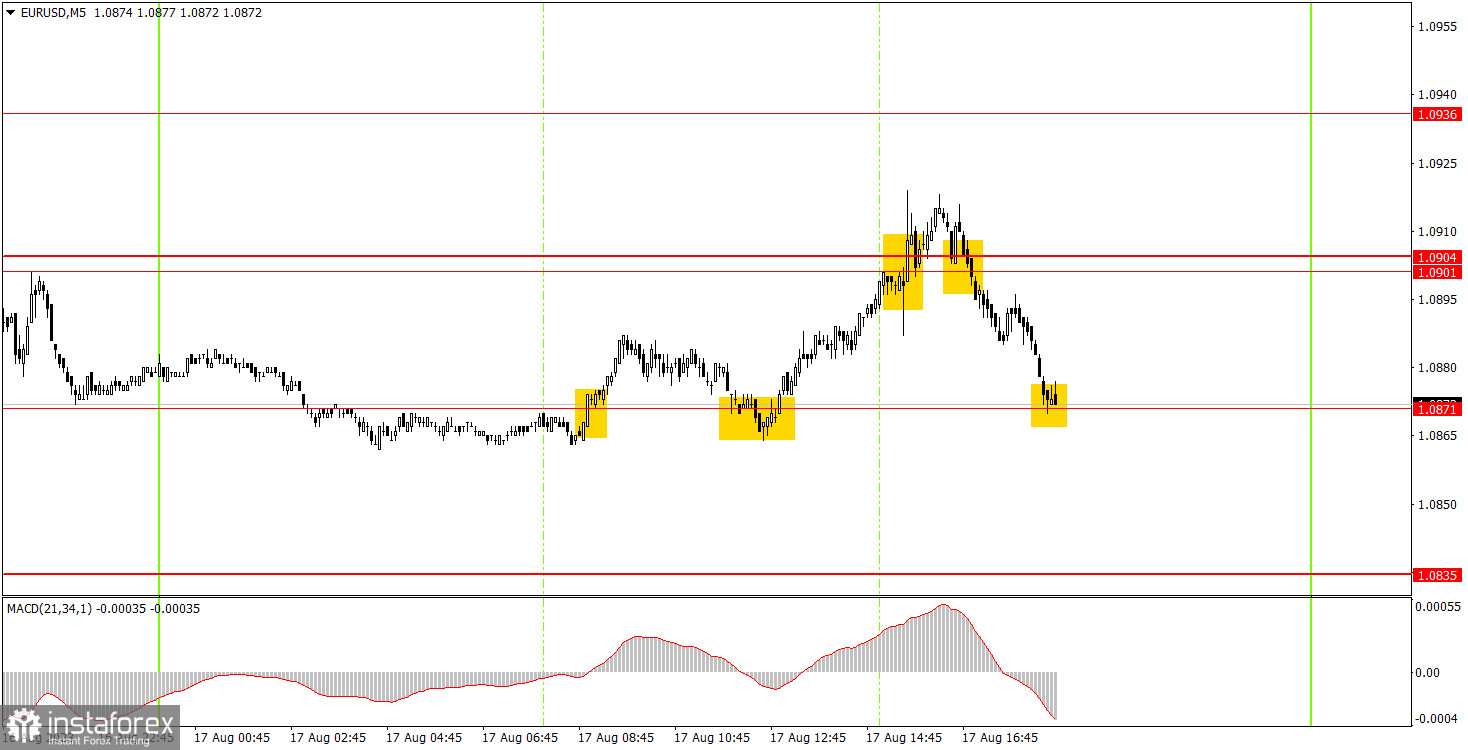
There were few trading signals on the 5-minute chart, and the pair spent almost the entire day in a sideways channel. Two bounces off the 1.0871 mark made it possible for beginners to open long positions, and consolidation below the 1.0901-1.0904 area called for the closure of longs and the opening of shorts, afterwards the pair returned to the 1.0871 mark. Thus, traders could earn about 15 points on the first deal and the same amount on the second.
On the 30M chart, the pair extends its downward movement, and in our opinion, this is still the most justified and logical course of events. We don't see any macroeconomic background that would be capable of changing market sentiment this week. It doesn't even have any impact on market sentiment. The key levels on the 5M chart are 1.0733, 1.0761, 1.0835, 1.0871, 1.0901-1.0904, 1.0936, 1.0971-1.0981, 1.1011, 1.1043, 1.1091. A stop loss can be set at a breakeven point as soon as the price moves 15 pips in the right direction. On Friday, the eurozone will publish the final assessment for its inflation report in July. The US economic calendar is basically empty. Most likely, it will be a boring day with the pair's systematic decline.
1) The strength of the signal depends on the time period during which the signal was formed (a rebound or a break). The shorter this period, the stronger the signal.
2) If two or more trades were opened at some level following false signals, i.e. those signals that did not lead the price to Take Profit level or the nearest target levels, then any consequent signals near this level should be ignored.
3) During the flat trend, any currency pair may form a lot of false signals or do not produce any signals at all. In any case, the flat trend is not the best condition for trading.
4) Trades are opened in the time period between the beginning of the European session and until the middle of the American one when all deals should be closed manually.
5) We can pay attention to the MACD signals in the 30M time frame only if there is good volatility and a definite trend confirmed by a trend line or a trend channel.
6) If two key levels are too close to each other (about 5-15 pips), then this is a support or resistance area.
Support and Resistance price levels can serve as targets when buying or selling. You can place Take Profit levels near them.
Red lines are channels or trend lines that display the current trend and show which direction is better to trade.
MACD indicator (14,22,3) is a histogram and a signal line showing when it is better to enter the market when they cross. This indicator is better to be used in combination with trend channels or trend lines.
Important speeches and reports that are always reflected in the economic calendars can greatly influence the movement of a currency pair. Therefore, during such events, it is recommended to trade as carefully as possible or exit the market in order to avoid a sharp price reversal against the previous movement.
Beginners should remember that every trade cannot be profitable. The development of a reliable strategy and money management are the key to success in trading over a long period of time.
InstaForex analytical reviews will make you fully aware of market trends! Being an InstaForex client, you are provided with a large number of free services for efficient trading.


