 Stay
Stay 
Trading Conditions
Products
Tools


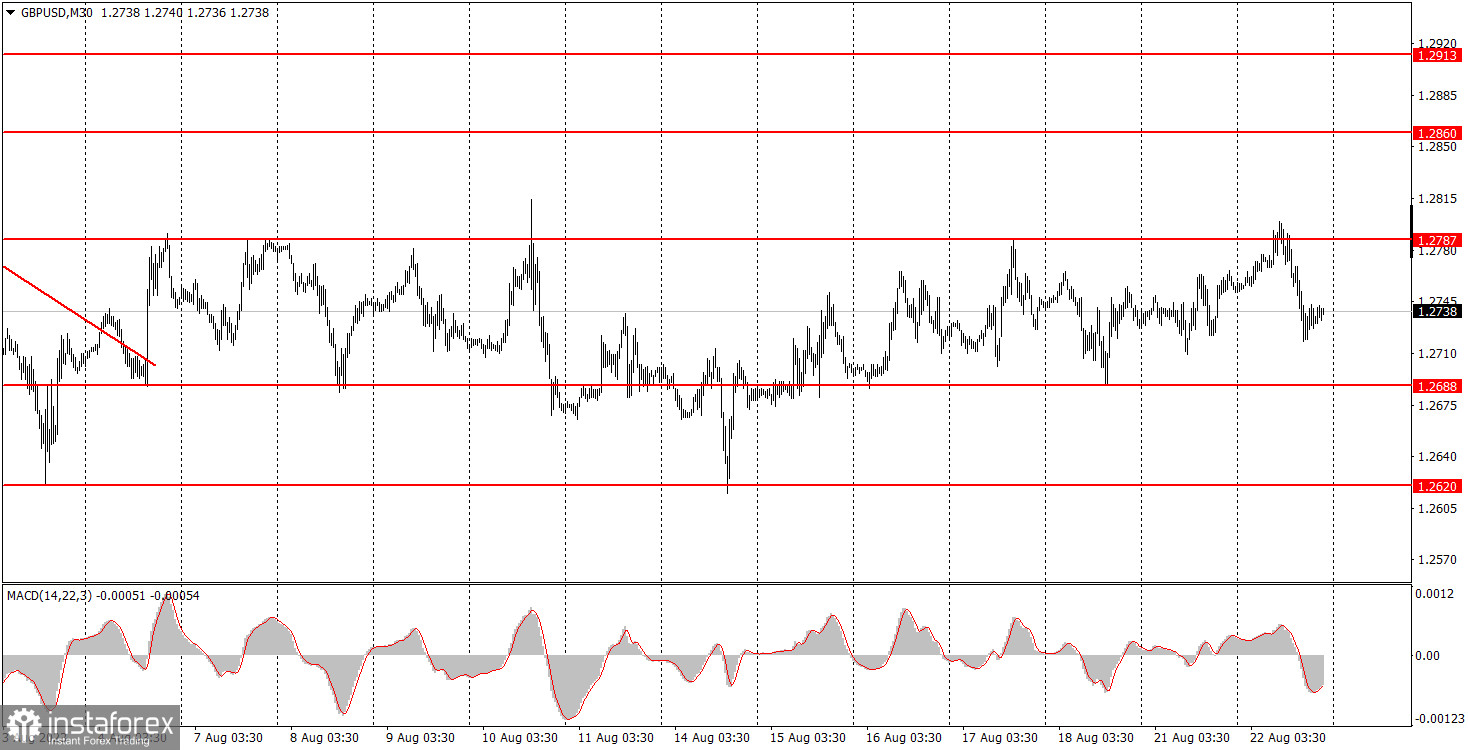
The GBP/USD pair showed quite an interesting downward movement on Tuesday. It retreated after testing the upper band of the sideways channel, in which it has been trading in for over three weeks. The chart above clearly shows what we mean. Thus, despite quite an interesting movement during the day (which was not provoked by a macroeconomic or fundamental background), the pair stayed within the sideways channel, meaning that the flat persists. We already mentioned this – no matter what movements we see, the pair is still moving sideways.
On Tuesday, there was nothing interesting about the economic calendar. One report in the US and a speech by a Federal Reserve official. Even if these events had a slim chance of affecting the market, they certainly aren't the reason for the dollar's growth. Since the upper band of the channel has been tested again, so now we can expect the pair to fall to the 1.2620 level.
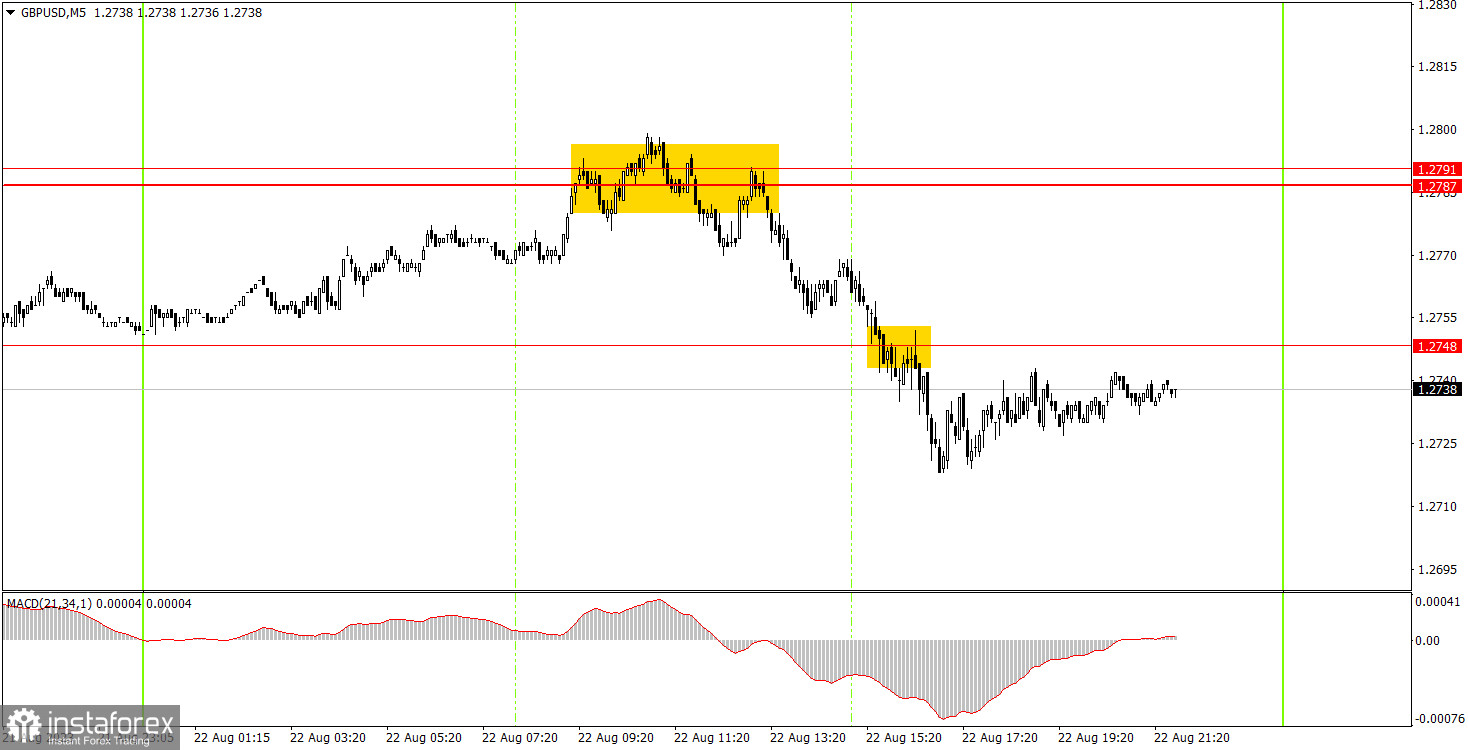
Two trading signals were formed on the 5-minute chart. During the European session, the pair hovered around the 1.2787-1.2791 area for several hours, afterwards it finally rebounded from it, forming a sell signal. Subsequently, the price successfully breached the 1.2748 level at its first attempt and there were no more signals for the rest of the day. Therefore, the short position should have been closed manually towards the evening, with a profit of no less than 40 pips, which is quite good given that volatility was 80 points.
On the 30-minute chart, the GBP/USD pair continues to move in a sideways channel. We still expect the pound to fall, as we still believe it is overbought and unreasonably expensive. However, the market has taken a break for now, so either trade within the sideways channel or wait for the flat to end. In the coming days, we can expect the pound to fall by about 100 pips. The key levels on the 5M chart are 1.2499, 1.2538, 1.2605-1.2620, 1.2653, 1.2688, 1.2748, 1.2787-1.2791, 1.2848-1.2860, and 1.2913. Once the price moves 20 pips in the right direction after opening a trade, you can set the stop-loss at breakeven. On Wednesday, PMIs in the services and manufacturing sectors will be published in both the UK and the US. These aren't crucial reports, and they are unlikely to move the pair out of the flat.
1) The strength of the signal depends on the time period during which the signal was formed (a rebound or a break). The shorter this period, the stronger the signal.
2) If two or more trades were opened at some level following false signals, i.e. those signals that did not lead the price to Take Profit level or the nearest target levels, then any consequent signals near this level should be ignored.
3) During the flat trend, any currency pair may form a lot of false signals or do not produce any signals at all. In any case, the flat trend is not the best condition for trading.
4) Trades are opened in the time period between the beginning of the European session and until the middle of the American one when all deals should be closed manually.
5) We can pay attention to the MACD signals in the 30M time frame only if there is good volatility and a definite trend confirmed by a trend line or a trend channel.
6) If two key levels are too close to each other (about 5-15 pips), then this is a support or resistance area.
Support and Resistance price levels can serve as targets when buying or selling. You can place Take Profit levels near them.
Red lines are channels or trend lines that display the current trend and show which direction is better to trade.
MACD indicator (14,22,3) is a histogram and a signal line showing when it is better to enter the market when they cross. This indicator is better to be used in combination with trend channels or trend lines.
Important speeches and reports that are always reflected in the economic calendars can greatly influence the movement of a currency pair. Therefore, during such events, it is recommended to trade as carefully as possible or exit the market in order to avoid a sharp price reversal against the previous movement.
Beginners should remember that every trade cannot be profitable. The development of a reliable strategy and money management are the key to success in trading over a long period of time.
InstaForex analytical reviews will make you fully aware of market trends! Being an InstaForex client, you are provided with a large number of free services for efficient trading.


