 Stay
Stay 
Trading Conditions
Products
Tools


The EUR/USD currency pair demonstrated notably erratic movements throughout Wednesday, navigating through a sea of macroeconomic data. It would be impractical to isolate specific reports to elucidate the pair's intraday movements. For instance, at least four reports, albeit of secondary nature, were published in the European Union before noon, collectively capable of triggering market reactions. September's business activity indices in the services sectors of Germany and the European Union slightly outperformed forecasts, the producer price index remained neutral, while retail sales fell short of expectations.
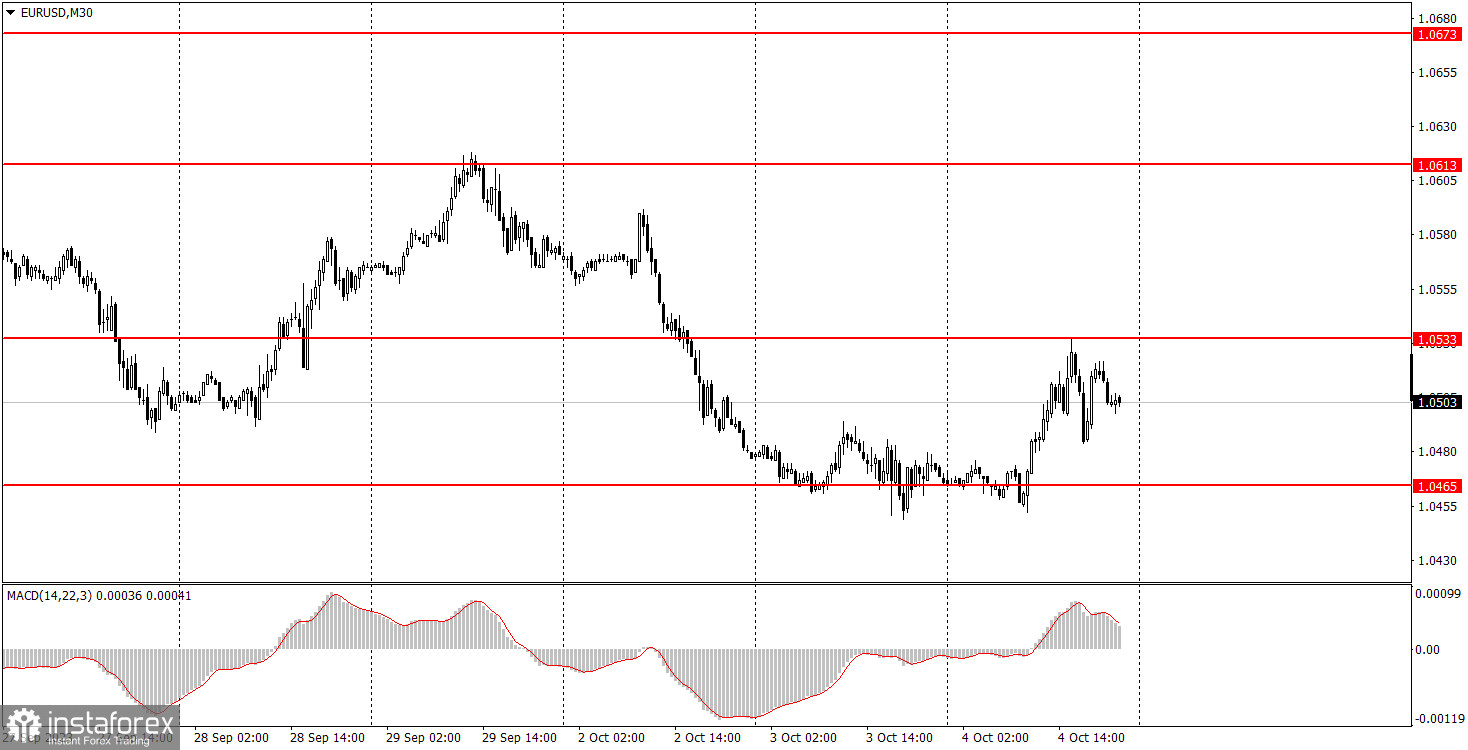
Interestingly, traders seemed to lean into the business activity indices, propelling a rise in the first half of the day. Contrarily, U.S. statistics in the latter half presented a mixed bag, with the ADP report underperforming expectations, while the ISM index met them, allowing observers to witness both a dip and a surge in the dollar. Overall, the downward trend persisted, and a swirl of upward correction continues to appear more logical.
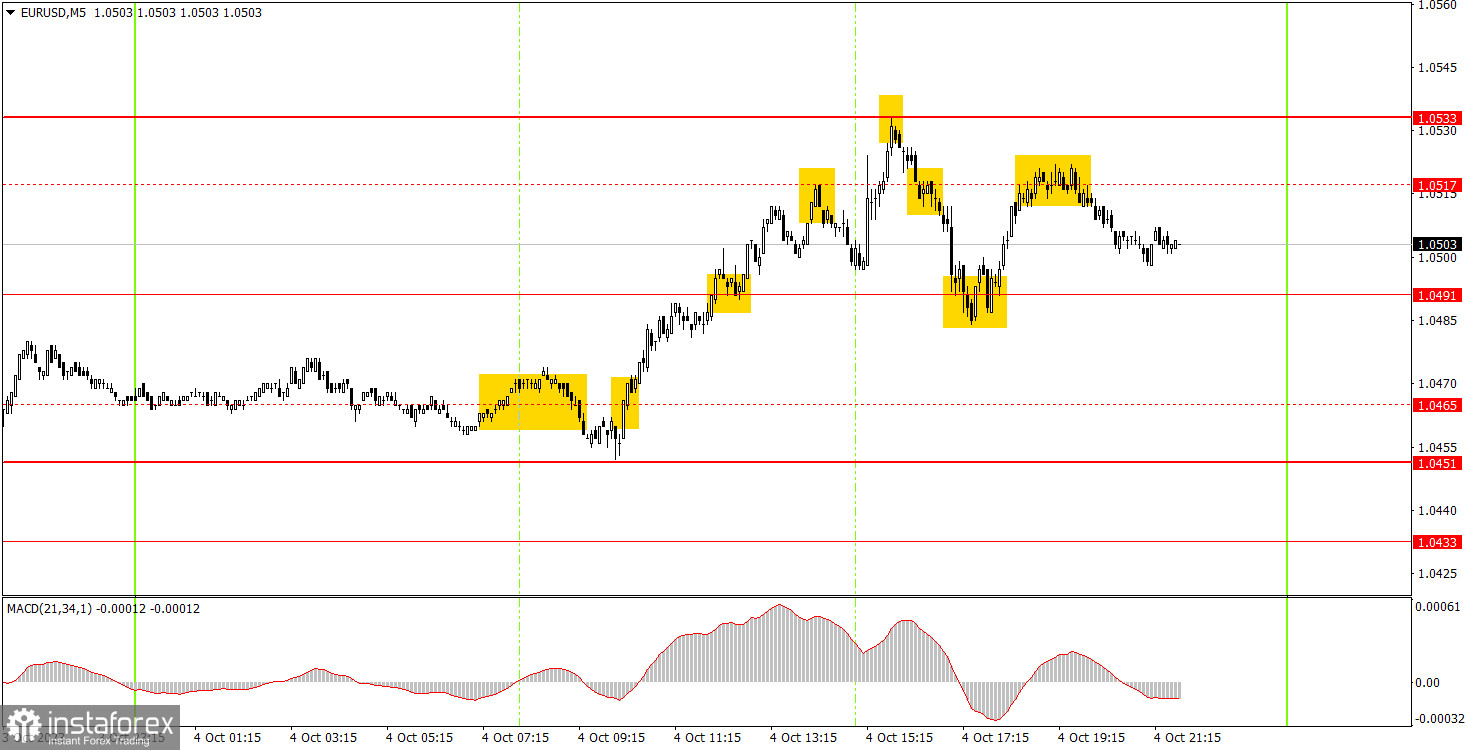
Wednesday on the 5-minute time frame saw a flurry of signals, albeit amidst chaotic movements due to a slew of macroeconomic releases. Even for novice traders, it should be evident that when a new report emerges every hour or so, the pair can perpetually shift directions. Naturally, such intraday fluctuations are challenging to navigate swiftly. While there were numerous signals today, beginners had to correlate them with published reports or opt to abstain from trading during releases. Without dissecting each trade, it's worth noting that the upward movement in the first half of the day presented a decent earning opportunity.
On the 30-minute TF, the pair may yet carve out a new wave of upward correction. In the medium-term perspective, we anticipate a dip in the Euro almost inevitably, yet the pair might resume its ascent in the upcoming days (given the notably weak correction on Thursday and Friday of the previous week). On the 5-minute TF, levels to consider tomorrow are 1.0391, 1.0433, 1.0451, 1.0491, 1.0533, 1.0611-1.0618, 1.0673, 1.0733, 1.0767-1.0781, and 1.0835. Upon traversing 15 points in the right direction, setting a Stop Loss to break-even is advisable. Thursday brings little to the spotlight in the EU and the US, aside from a few speeches by ECB and FED representatives. While volatility may once again diminish tomorrow, a notably intriguing and pivotal day lies ahead.
1) Signal strength is determined by the time taken for its formation (either a bounce or level breach). A shorter formation time indicates a stronger signal.
2) If two or more trades around a certain level are initiated based on false signals, subsequent signals from that level should be disregarded.
3) In a flat market, any currency pair can produce multiple false signals or none at all. In any case, the flat trend is not the best condition for trading.
4) Trading activities are confined between the onset of the European session and mid-way through the U.S. session, post which all open trades should be manually closed.
5) On the 30-minute timeframe, trades based on MACD signals are only advisable amidst substantial volatility and an established trend, confirmed either by a trend line or trend channel.
6) If two levels lie closely together (ranging from 5 to 15 pips apart), they should be considered as a support or resistance zone.
Support and Resistance price levels can serve as targets when buying or selling. You can place Take Profit levels near them.
Red lines represent channels or trend lines, depicting the current market trend and indicating the preferable trading direction.
The MACD(14,22,3) indicator, encompassing both the histogram and signal line, acts as an auxiliary tool and can also be used as a signal source.
Significant speeches and reports (always noted in the news calendar) can profoundly influence the price dynamics. Hence, trading during their release calls for heightened caution. It may be reasonable to exit the market to prevent abrupt price reversals against the prevailing trend.
Beginning traders should always remember that not every trade will yield profit. Establishing a clear strategy coupled with sound money management is the cornerstone of sustained trading success.
InstaForex analytical reviews will make you fully aware of market trends! Being an InstaForex client, you are provided with a large number of free services for efficient trading.

