 Stay
Stay 
Trading Conditions
Products
Tools


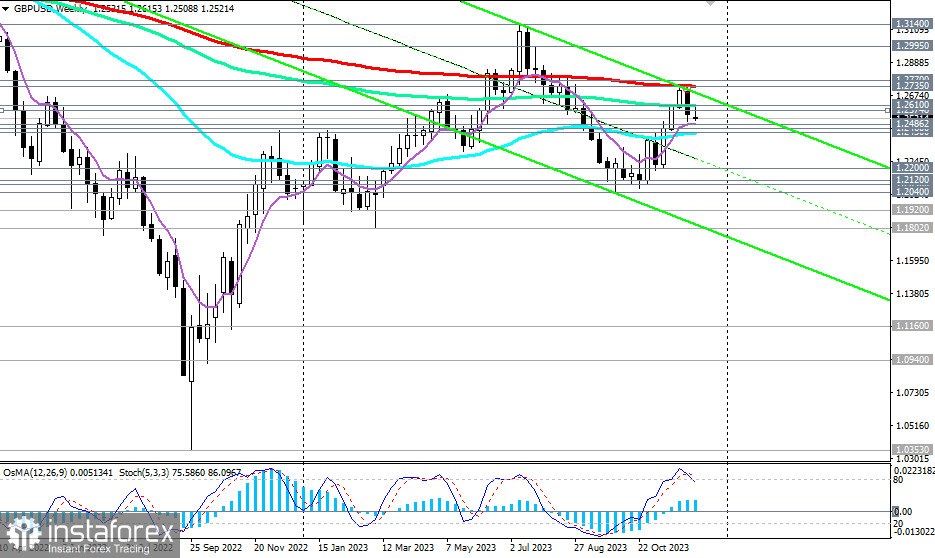
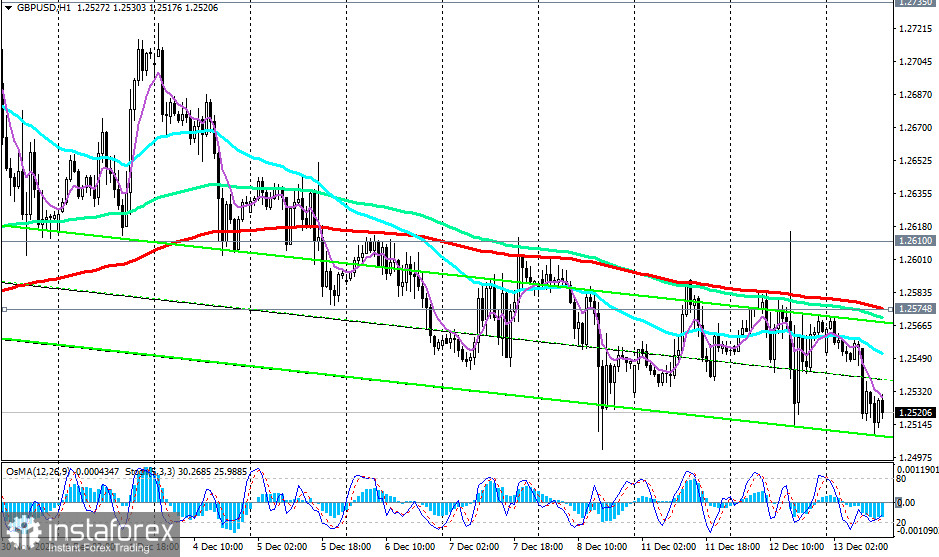
GBP/USD continues to decline after breaking through two important support levels last week at 1.2614 (200 EMA on the 1-hour chart at that time) and 1.2610 (144 EMA on the weekly chart).
As long as GBP/USD remains in the zone of the long-term bearish market, below the key resistance level of 1.2735 (200 EMA on the weekly chart), short positions remain preferable, and currently, a downward trend prevails for the pair.
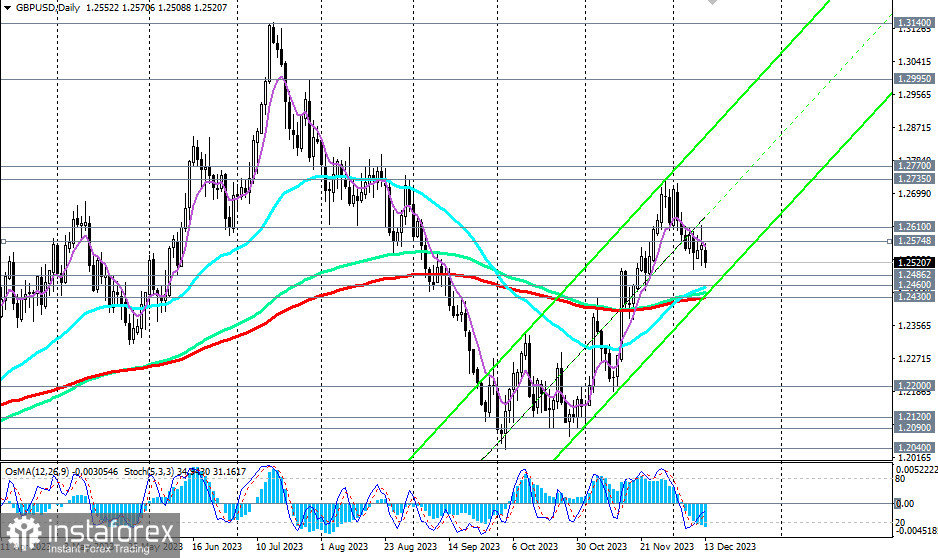
The risks of further GBP/USD decline still outweigh the prospects of its growth. The breakdown of the key support level 1.2430 (200 EMA on the daily chart) will be critical for the currency pair, which will indicate a transition to the medium-term bearish market zone and a resumption of the long-term downward trend.
The first signal for the development of this scenario is the breakdown of the "round" support level of 1.2500.
It is also noteworthy that on the weekly chart, technical indicators OsMA and Stochastic are starting to turn down, signaling a resumption of decline in the long term.
In an alternative scenario and after breaking through the resistance zone at levels 1.2600 and 1.2610, the upward correction will resume. The first signal to implement the alternative scenario is the breakout of the resistance level at 1.2575 (200 EMA on the 1-hour chart at the moment).
However, for a breakout into the long-term bullish market zone, the price must overcome key long-term resistance levels 1.2735 (200 EMA on the weekly chart) and 1.2770 (50 EMA on the monthly chart).
Short positions are preferable at the moment.
Support levels: 1.2500, 1.2486, 1.2460, 1.2430, 1.2400, 1.2300, 1.2200, 1.2120, 1.2100, 1.2090, 1.2040, 1.2000
Resistance levels: 1.2575, 1.2600, 1.2610, 1.2700, 1.2735, 1.2770, 1.2800, 1.2900, 1.2995, 1.3100, 1.3140, 1.3200
Trading Scenarios
Main Scenario: Sell Stop 1.2485. Stop-Loss 1.2575. Targets 1.2460, 1.2430, 1.2400, 1.2300, 1.2200, 1.2120, 1.2100, 1.2090, 1.2040, 1.2000
Alternative Scenario: Buy Stop 1.2575. Stop-Loss 1.2485. Targets 1.2600, 1.2610, 1.2700, 1.2735, 1.2770, 1.2800, 1.2900, 1.2995, 1.3100, 1.3140, 1.3200
"Targets" correspond to support/resistance levels. This also does not mean that they will necessarily be reached, but they can serve as a guide when planning and placing your trading positions.
InstaForex analytical reviews will make you fully aware of market trends! Being an InstaForex client, you are provided with a large number of free services for efficient trading.

