 Stay
Stay 
Trading Conditions
Products
Tools


EUR/USD failed to extend the downward movement that started on Friday. The price moved with low volatility, which did not surpass 40 pips. Therefore, there was generally no movement, which we already warned you about. There was no fundamental and macroeconomic background. Federal Reserve official John Williams spoke, suggesting that Powell's speech last week does not mean the beginning of a policy easing in January or March. The key rate cut is planned for next year, not immediately, but when inflation allows. However, this speech had no effect on the dollar.
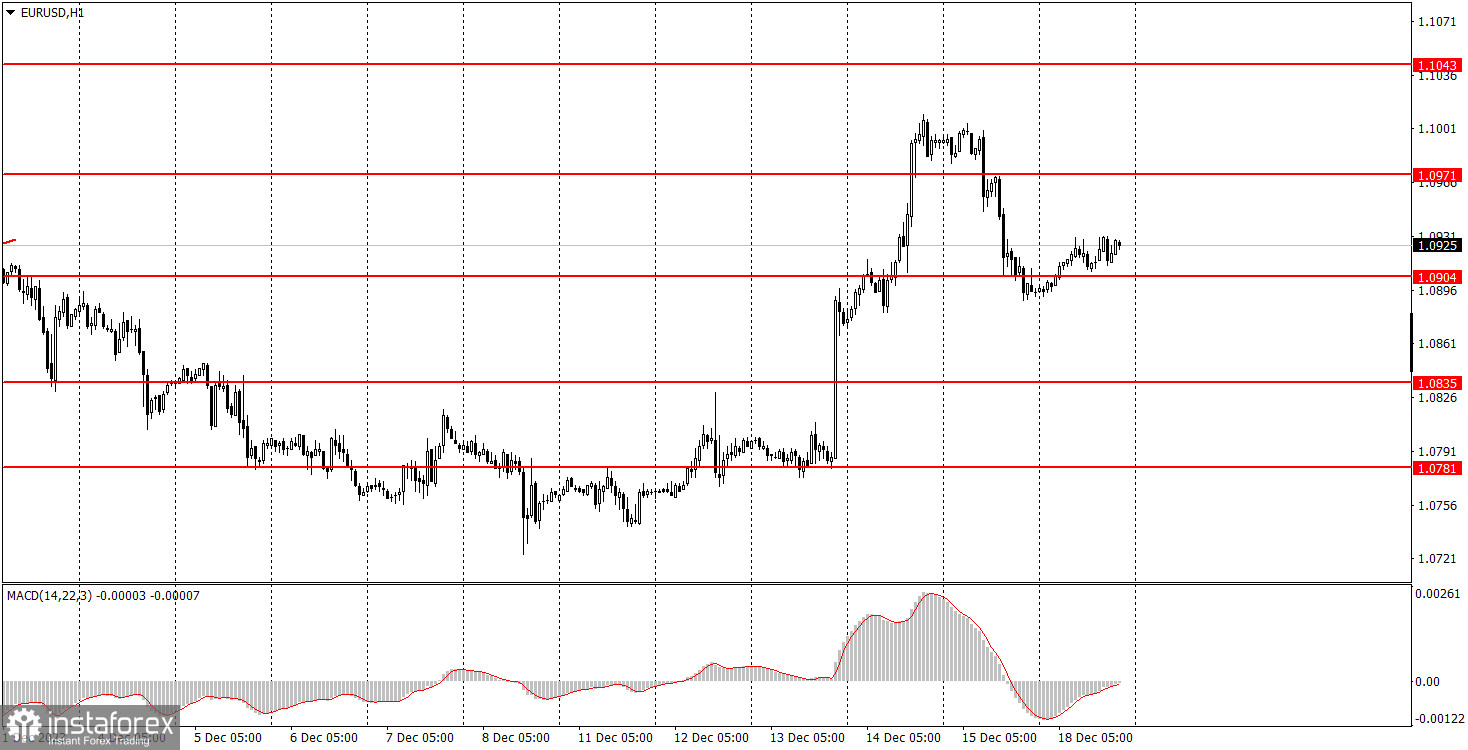
The technical picture has not changed. The pair rallied thanks to the meetings of the Fed and the European Central Bank last week, as well as the speeches of Powell and Lagarde. And now the euro has no reason to rise. However, we have already mentioned that the euro does not have substantial grounds to strengthen further, and it still doesn't have any. From time to time, events and reports allow it to rise, but so far, this growth is still interpreted as part of a corrective phase.
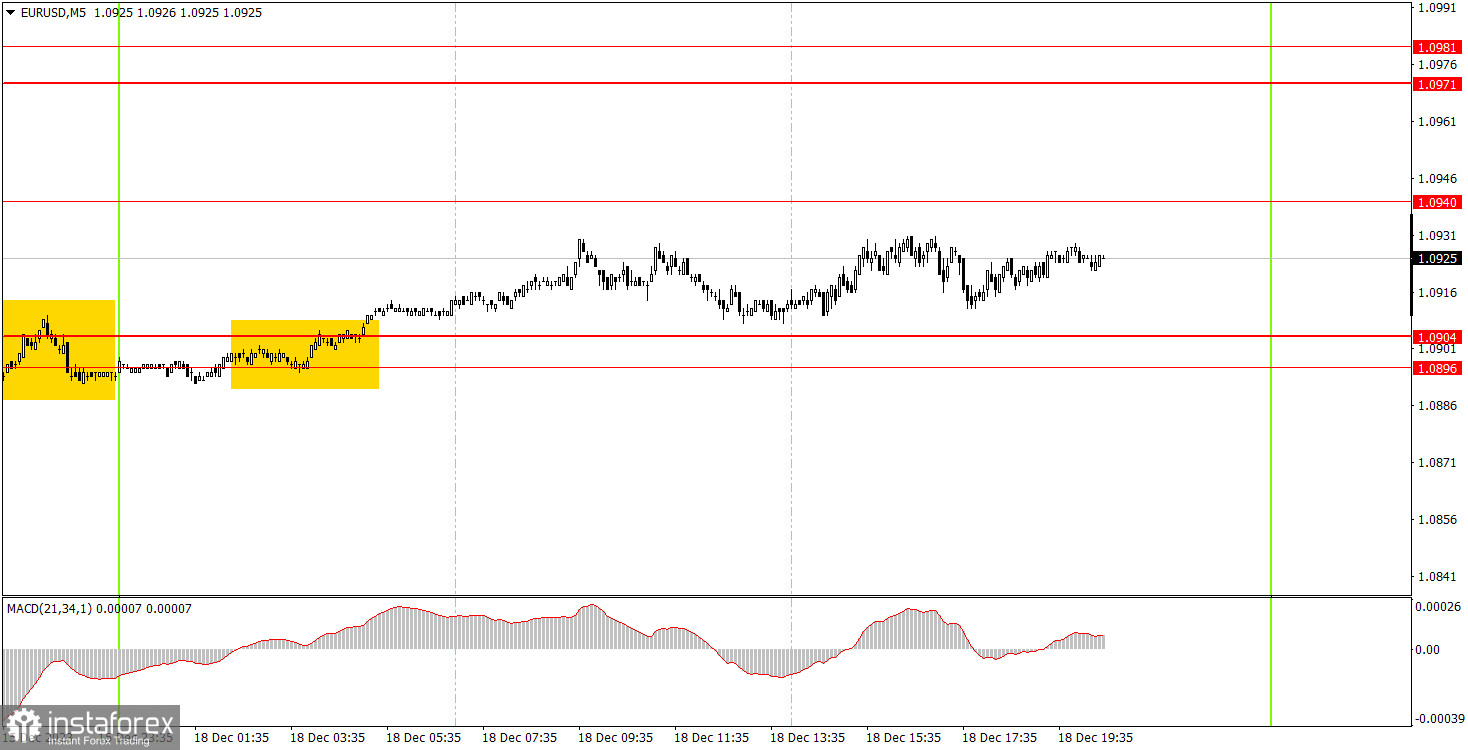
On the 5-minute chart, the price practically stood still on Monday. The only trading signal of the day was formed at night when the price bounced off the 1.0896-1.0904 area. During the day, it barely rose by 16 pips, so a Stop Loss should have been set to breakeven for a long position. However, the pair did not return to the level of 1.0904 or rise to the level of 1.0940. Novices could close a long position anywhere and make a bit of profit.
On the hourly chart, EUR/USD started a strong uptrend, but it can also end it at any moment. We believe that the euro does not have enough reasons to rise further. Last week, the growth was supported by the fundamental background, but it will no longer receive the same support this week.
On Tuesday, we suggest that you continue to closely monitor the area of 1.0896-1.0904. So far, the pair has rebounded from the area, so the pair may climb up a little more, but afterwards it should return. You can open new short positions when the pair breaks through this area and count on a drop down to the 7th level.
The key levels on the 5M chart are 1.0611-1.0618, 1.0668, 1.0733, 1.0767-1.0781, 1.0835, 1.0896-1.0904, 1.0940, 1.0971-1.0981, 1.1011, 1.1043, 1.1091, 1.1132-1.1145. On Tuesday, the final reading of the Eurozone Harmonized Index of Consumer Prices (HICP) for November will be published, which is in some ways important, but is unlikely to provoke even a weak market reaction in practice. Second estimates rarely differ from the first reading. From the US, a secondary report on building permits will be due, which is not exactly important.
1) Signal strength is determined by the time taken for its formation (either a bounce or level breach). A shorter formation time indicates a stronger signal.
2) If two or more trades around a certain level are initiated based on false signals, subsequent signals from that level should be disregarded.
3) In a flat market, any currency pair can produce multiple false signals or none at all. In any case, the flat trend is not the best condition for trading.
4) Trading activities are confined between the onset of the European session and mid-way through the U.S. session, post which all open trades should be manually closed.
5) On the 30-minute timeframe, trades based on MACD signals are only advisable amidst substantial volatility and an established trend, confirmed either by a trend line or trend channel.
6) If two levels lie closely together (ranging from 5 to 15 pips apart), they should be considered as a support or resistance zone.
Support and Resistance price levels can serve as targets when buying or selling. You can place Take Profit levels near them.
Red lines represent channels or trend lines, depicting the current market trend and indicating the preferable trading direction.
The MACD(14,22,3) indicator, encompassing both the histogram and signal line, acts as an auxiliary tool and can also be used as a signal source.
Significant speeches and reports (always noted in the news calendar) can profoundly influence the price dynamics. Hence, trading during their release calls for heightened caution. It may be reasonable to exit the market to prevent abrupt price reversals against the prevailing trend.
Beginning traders should always remember that not every trade will yield profit. Establishing a clear strategy coupled with sound money management is the cornerstone of sustained trading success.
InstaForex analytical reviews will make you fully aware of market trends! Being an InstaForex client, you are provided with a large number of free services for efficient trading.

