 Stay
Stay 
Trading Conditions
Products
Tools


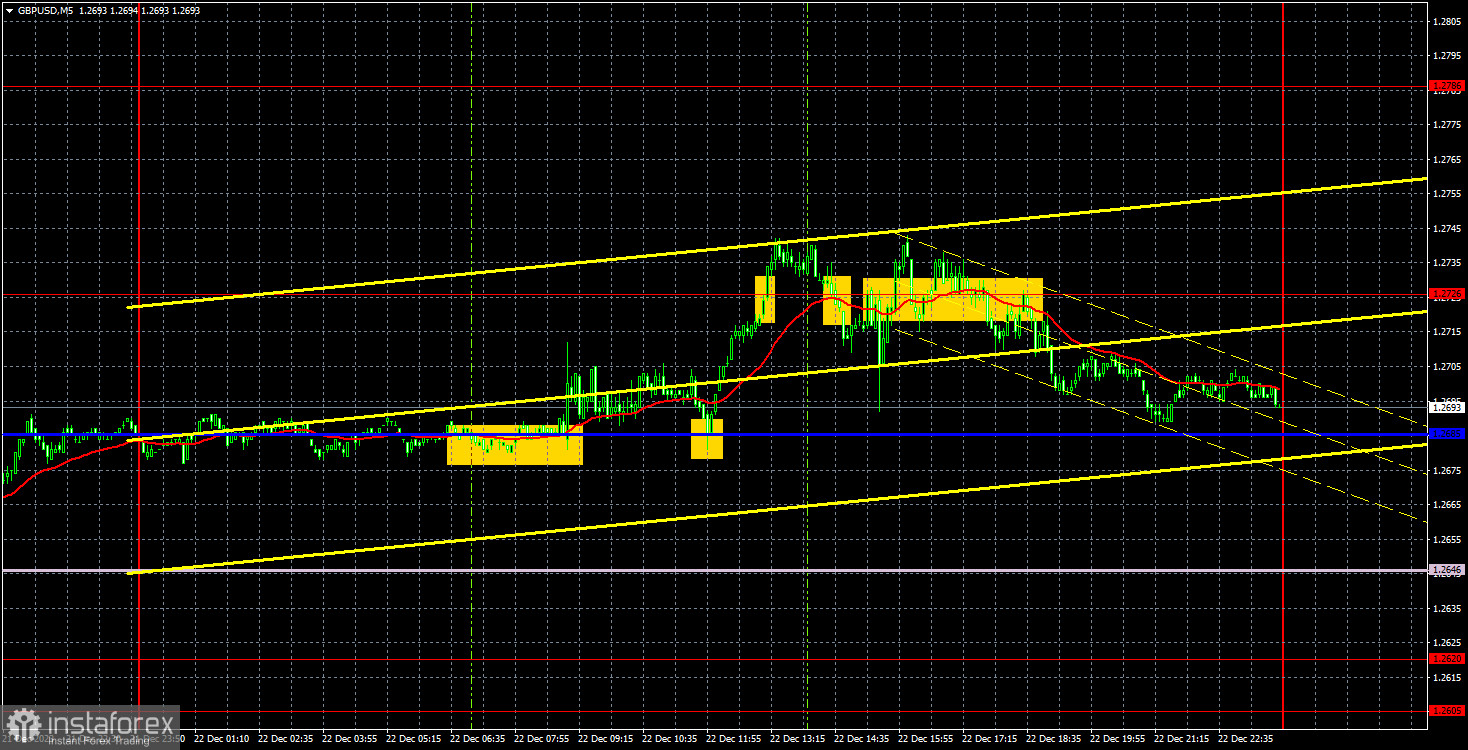
GBP/USD traded higher on Friday. However, this time it was short-lived. Pay attention to the pair's movement in recent weeks: each subsequent high is lower than the previous one, and each subsequent low is lower than the previous one. Such a pattern allows us to assume that this week, the pair may fall to the area of 1.2605-1.2620. The Ichimoku indicator lines are unlikely to significantly hinder such movement, as the price has been overcoming them quite easily lately.
The British currency still has no reason to rise further. There were none on Friday when the UK event calendar was completely empty, and in the US, four reports were released, two of which supported the dollar, and two were neutral. Take note that the dollar strengthened in the second half of the day, but again, it was quite a weak growth. So far, the market maintains a bullish bias, and it is unlikely to change significantly this week, which is the final one of the year. Macroeconomic and fundamental background will be absent, many banks, exchanges, and platforms will be closed.
Speaking of trading signals, they were not the best on Friday. In the first half of the day, it was still possible to expect profit, as the pound suddenly rose by 55 pips. Before this, two buy signals were formed near the critical line, so traders could open long positions and make profit from them. During the US session, the price started to fluctuate around the level of 1.2726, so it was better to leave the market as quickly as possible. The British pound rose out of the blue, and the dollar strengthened after the release of decent reports. This is how the GBP/USD pair is currently moving.
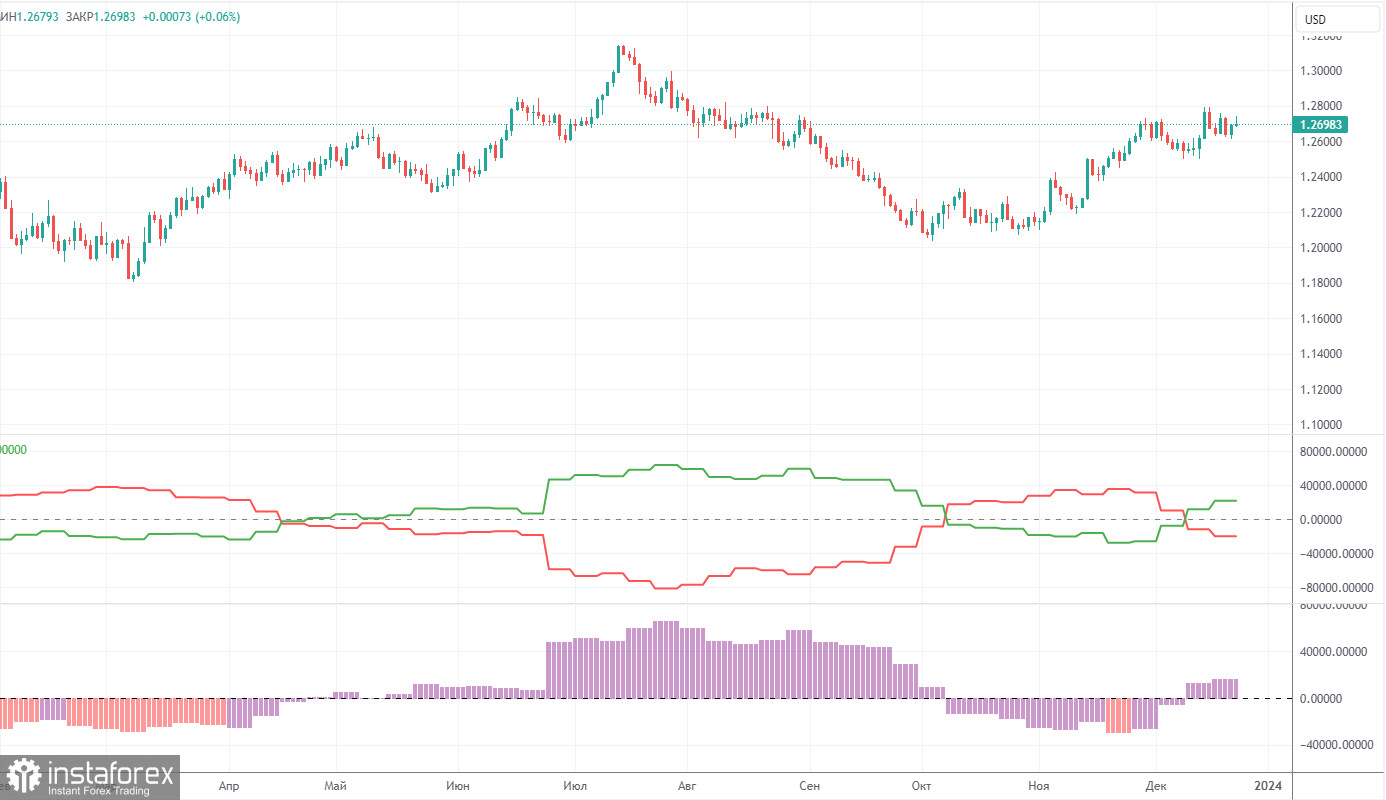
COT reports on the British pound show that the sentiment of commercial traders has been changing quite frequently in recent months. The red and green lines, representing the net positions of commercial and non-commercial traders, often intersect and, in most cases, are not far from the zero mark. According to the latest report on the British pound, the non-commercial group closed 3,200 buy contracts and 1,500 short ones. Therefore, the net position of non-commercial traders decreased by 1,700 contracts in a week. The changes are negligible. Since bulls don't have the advantage, we believe that the pound will not be able to continue the upward movement for a long time.
The non-commercial group currently has a total of 68,800 long positions and 48,900 short ones. Since the COT reports cannot make an accurate forecast of the market's behavior right now, and the fundamentals are practically the same for both currencies, we can only assess the technical picture and economic reports. The technical analysis allows us to expect a strong decline, and the economic reports have been significantly stronger in the United States than in the United Kingdom for quite some time now.
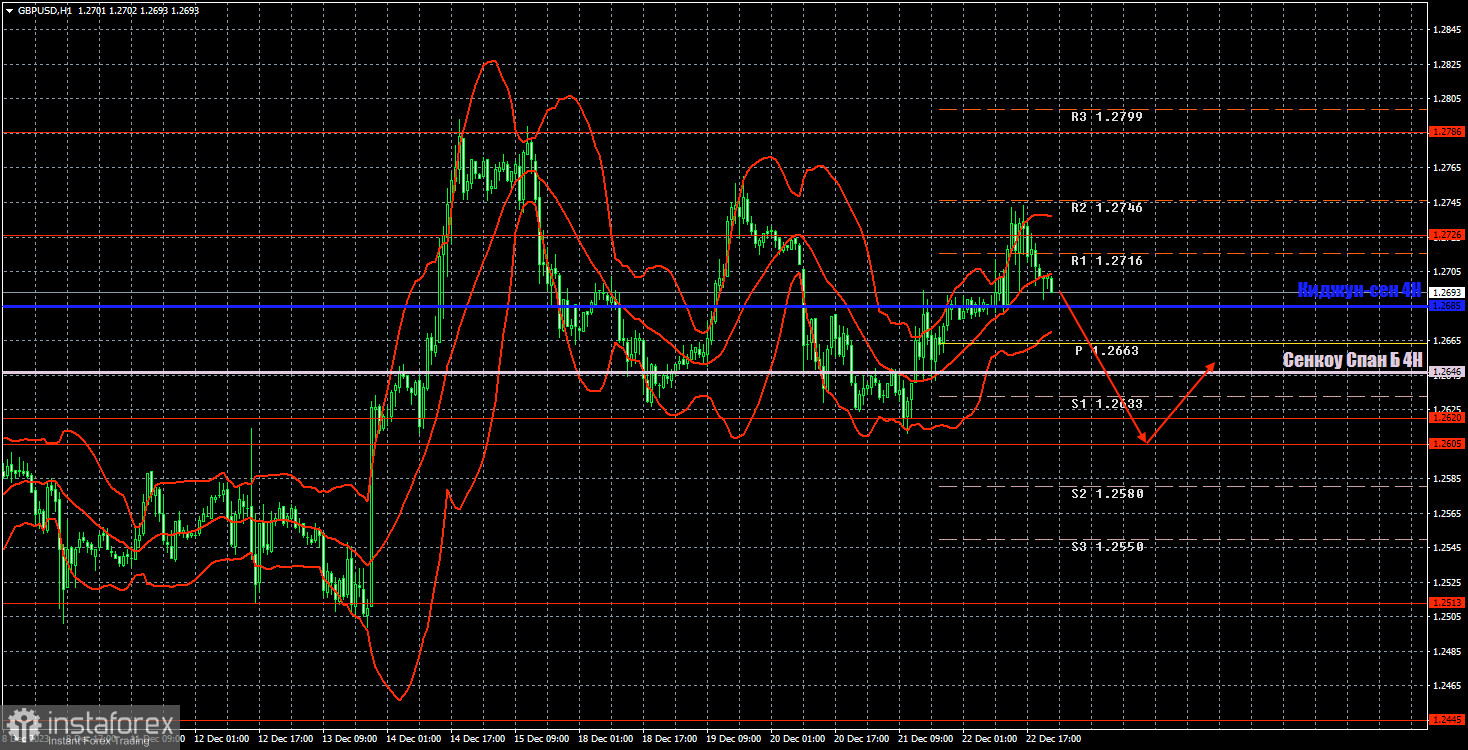
On the 1H chart, GBP/USD is making every effort to correct lower, but the uptrend persists. We believe that there are no reasons for the British pound to experience long-term growth, and there still aren't any. Therefore, at the very least, we expect the pair to return to the level of 1.2513. In the near term, the price may drop to the level of 1.2605. But it would be foolish to deny that the uptrend persists, so selling without appropriate signals is risky.
Today, we can consider the possibility that a new downturn has already started. The price rebounded somewhat from the level of 1.2726, so now we can consider selling using 1.2620-1.2605 as a target. We will consider long positions after working out the aforementioned area. This week's movements might be weak and close to a flat.
As of December 26, we highlight the following important levels: 1.2109, 1.2215, 1.2269, 1.2349, 1.2429-1.2445, 1.2513, 1.2605-1.2620, 1.2726, 1.2786, 1.2863, 1.2981-1.2987. The Senkou Span B lines (1.2646) and Kijun-sen (1.2685) lines can also be sources of signals. Signals can be "bounces" and "breakouts" of these levels and lines. It is recommended to set the Stop Loss level to break-even when the price moves in the right direction by 20 pips. The Ichimoku indicator lines can move during the day, which should be taken into account when determining trading signals. The illustration also includes support and resistance levels that can be used to lock in profits from trades.
On Tuesday, the US and the UK event calendars are empty, so we don't expect strong movements during the day. If the pair continues to gradually fall, that would be the best scenario.
Support and resistance levels are thick red lines near which the trend may end. They do not provide trading signals;
The Kijun-sen and Senkou Span B lines are the lines of the Ichimoku indicator, plotted to the 1H timeframe from the 4H one. They provide trading signals;
Extreme levels are thin red lines from which the price bounced earlier. They provide trading signals;
Yellow lines are trend lines, trend channels, and any other technical patterns;
Indicator 1 on the COT charts is the net position size for each category of traders;
Indicator 2 on the COT charts is the net position size for the Non-commercial group.
InstaForex analytical reviews will make you fully aware of market trends! Being an InstaForex client, you are provided with a large number of free services for efficient trading.


