 Stay
Stay 
Trading Conditions
Products
Tools


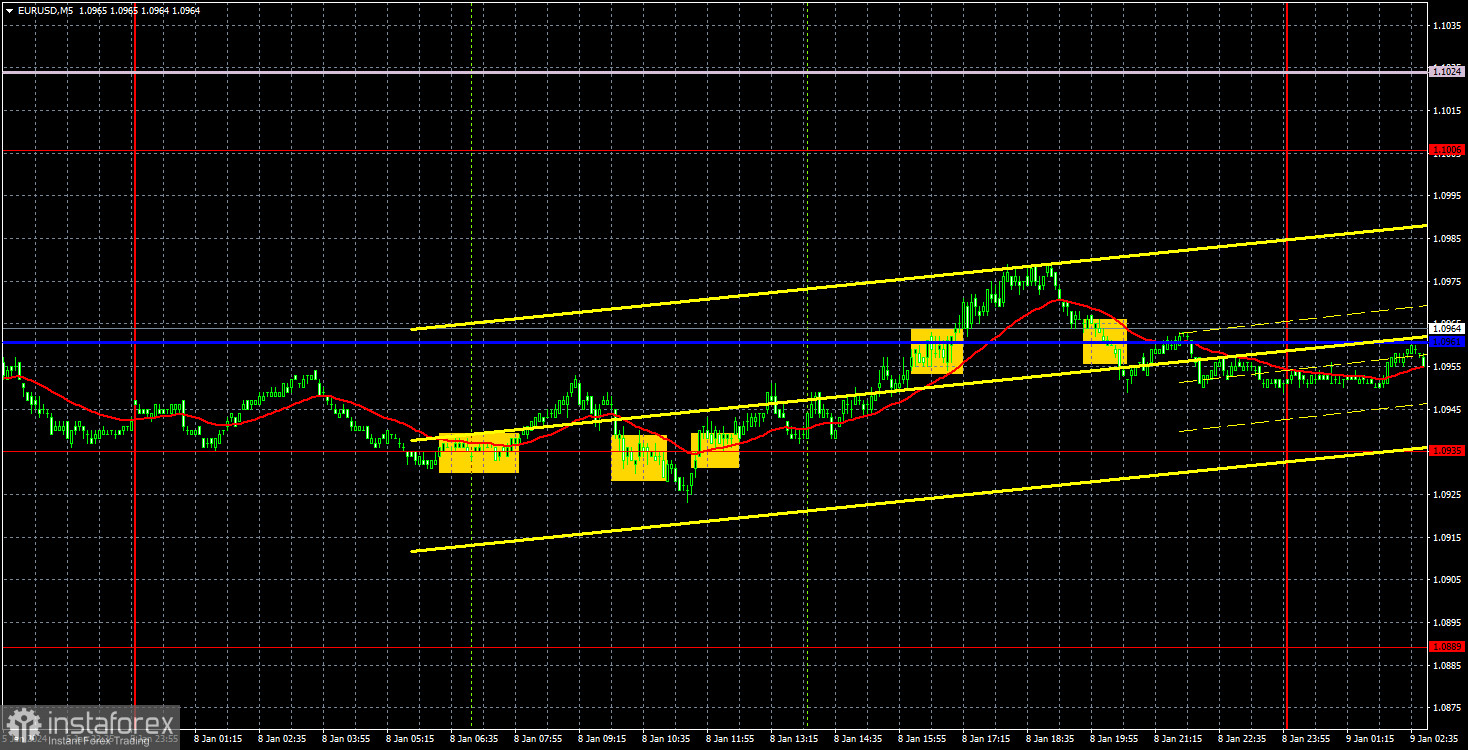
On Monday, EUR/USD showed relatively weak volatility but still managed to edge up. However, in reality, the pair strengthened within a limited price range and it has been trading in this area for several days now. This range doesn't have clear boundaries, but it is well illustrated above. The pair has been changing direction quite frequently in recent days but seems to lean towards a bullish correction. Or is it the continuation of the uptrend?
We still believe that there are no grounds for the euro to rise, and the beginning of the new year has not provided any other reasons for it. Yes, inflation in the European Union has increased, but that doesn't necessarily mean that the European Central Bank will consider further tightening of monetary policy. Inflation in the United States has not shown significant signs of slowing down recently and may accelerate again in December. This means that the euro and the dollar are in similar conditions in this regard.
Therefore, considering the three-month rise of the pair, we look forward to a continuation of the downward movement. We have to remind you that any fundamental assumption should be supported by concrete technical signals. Currently, we haven't seen much of these signals. The price is below the Senkou Span B line, which is important, so it may strive to reach it in the near future as part of a correction. Until it surpasses this line, we believe that the downtrend remains intact.
The EU only released one report yesterday. Retail sales decreased again, but the market already expected this, so there was no significant reaction to the report. Overall, there will be very few important events this week.
Speaking of trading signals, there were quite a few yesterday, but due to the weak movements, almost all of them turned out to be false. During the European trading session, the pair formed three signals around the 1.0935 level, and only the last one could be considered correct as the price tested the Kijun-sen line. However, yesterday morning, we warned you that we may encounter a flat phase and low volatility, which could lead to false signals. You should have traded carefully and cautiously.
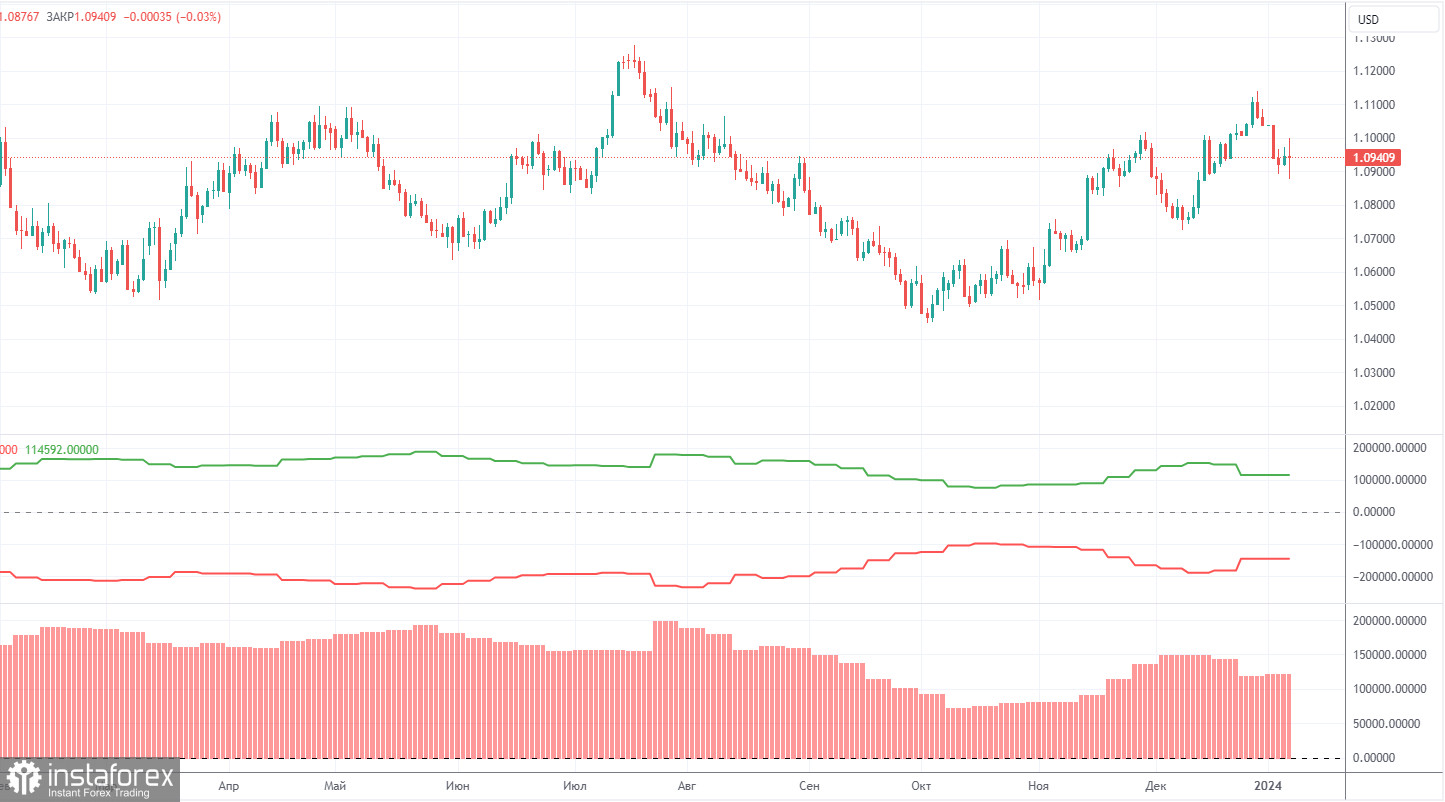
The latest COT report is dated January 2nd. In the first half of 2023, the net position of commercial traders hardly increased, but the euro remained relatively high during that period. Then, the euro and the net position both fell for several months, as we anticipated. However, in the last few weeks, both the euro and the net position have been rising. Therefore, we can conclude that the pair is correcting higher, but the corrections cannot last forever because they are just corrections.
We have previously pointed out that the red and green lines have moved significantly apart from each other, which often precedes the end of a trend. Currently, these lines are moving apart again. Therefore, we support the scenario where the euro should fall and the upward trend must end. During the last reporting week, the number of long positions for the non-commercial group increased by 700, while the number of short positions decreased by 1,300. Consequently, the net position increased by 2,000. The number of buy contracts is still higher than the number of sell contracts among non-commercial traders by 120,000. The gap is significant, and even without COT reports, it is clear that the euro should continue to fall.
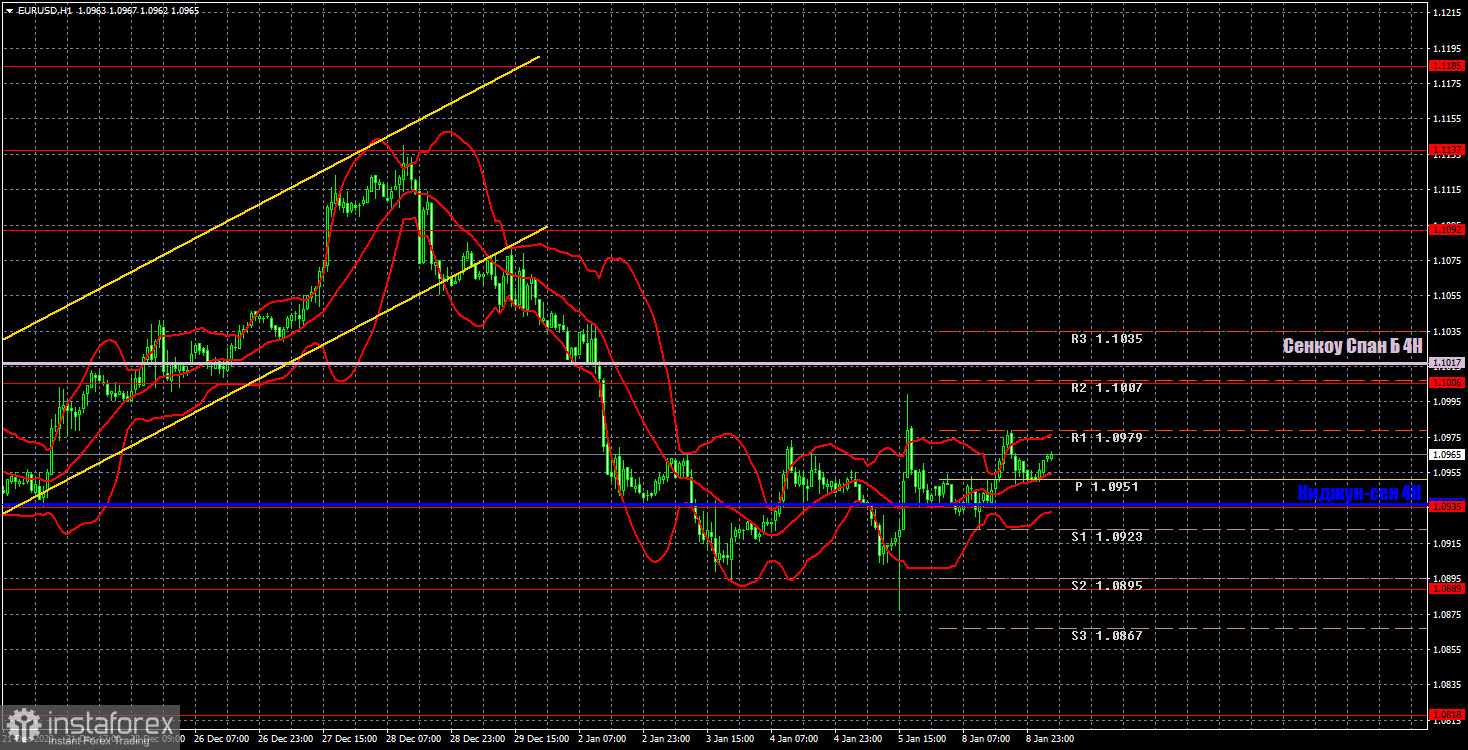
On the 1-hour chart, EUR/USD remains below the Senkou Span B line, so the downtrend persists. The level of 1.0889 is currently preventing the euro from falling further, but overall, we continue to advocate for a long and pronounced decline.
Today, we think it is reasonable to expect that the pair may eventually fall back to the level of 1.0889. Monday turned out to be quite an uneventful day, and Tuesday won't be much better, as the fundamental and macroeconomic background is practically absent again. Therefore, strong price fluctuations are not expected.
On January 9, we highlight the following levels for trading: 1.0658-1.0669, 1.0757, 1.0818, 1.0889, 1.0935, 1.1006, 1.1092, 1.1137, 1.1185, 1.1234, 1.1274, as well as the Senkou Span B line (1.1017) and the Kijun-sen (1.0937). The Ichimoku indicator lines can shift during the day, so this should be taken into account when identifying trading signals. Don't forget to set a breakeven Stop Loss if the price has moved in the intended direction by 15 pips. This will protect you against potential losses if the signal turns out to be false.
On Tuesday, Germany will release a report on industrial production, and the European Union will provide data on the unemployment rate. Both of these reports are considered secondary of importance, so we do not expect significant market reactions to the reports.
Support and resistance levels are thick red lines near which the trend may end. They do not provide trading signals;
The Kijun-sen and Senkou Span B lines are the lines of the Ichimoku indicator, plotted to the 1H timeframe from the 4H one. They provide trading signals;
Extreme levels are thin red lines from which the price bounced earlier. They provide trading signals;
Yellow lines are trend lines, trend channels, and any other technical patterns;
Indicator 1 on the COT charts is the net position size for each category of traders;
Indicator 2 on the COT charts is the net position size for the Non-commercial group.
InstaForex analytical reviews will make you fully aware of market trends! Being an InstaForex client, you are provided with a large number of free services for efficient trading.

