 Stay
Stay 
Trading Conditions
Products
Tools


EUR/USD once again showed weak volatility and sideways movement on Tuesday. We mentioned that the price has been trading within a sideways channel of 1.0904-1.0971 for the past four days. Since the price rebounded from the upper line of this channel on Monday evening, it was reasonable to expect a move towards the lower boundary, which is what we saw.
It's challenging to trade in a low-volatility range. There were no important reports or events that could help traders or even slightly amplify the movement. Therefore, it was initially very difficult to expect strong signals, significant movements, or high profits. Unfortunately, there are hardly any important reports and events this week, so throughout the entire week, we might witness the same movement the pair exhibited on Monday and Tuesday.
In general, we expect the euro to fall. The likelihood of a Federal Reserve rate cut in March is gradually decreasing, which should provide support to the US dollar, which has been unfairly depreciating in recent weeks. In any case, there are currently no signals indicating a new upward trend.
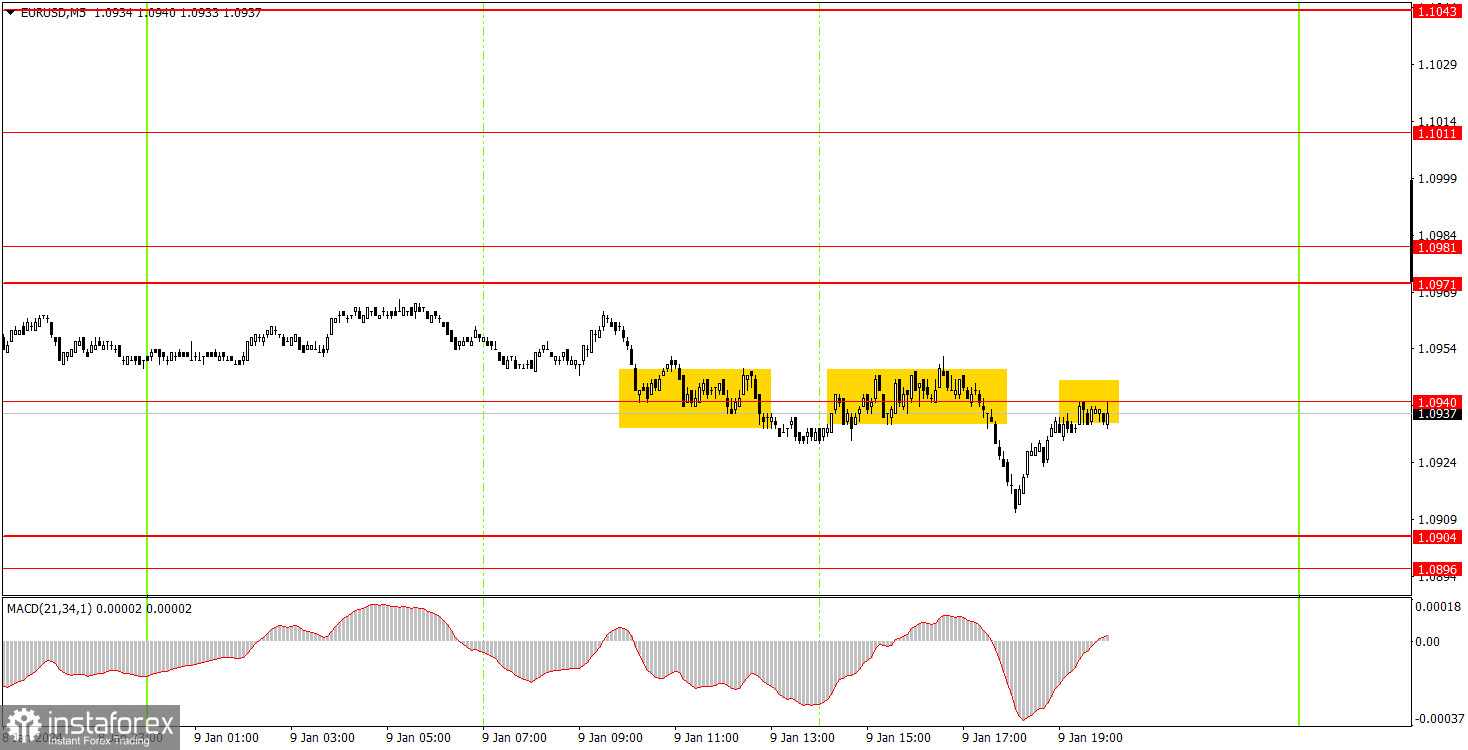
The 5-minute chart shows that the pair's movement was akin to that of a flat. All three trading signals of the day were formed around the 1.0940 level. They were as weak as the pair's movement during the day. Initially, the price settled below that level, then bounced imprecisely from it from below, and then simply returned to it without even forming a new signal. Therefore, beginners could open one short position. However, the price did not reach the nearest target level at 1.0904, so the trade closed at breakeven with a Stop Loss.
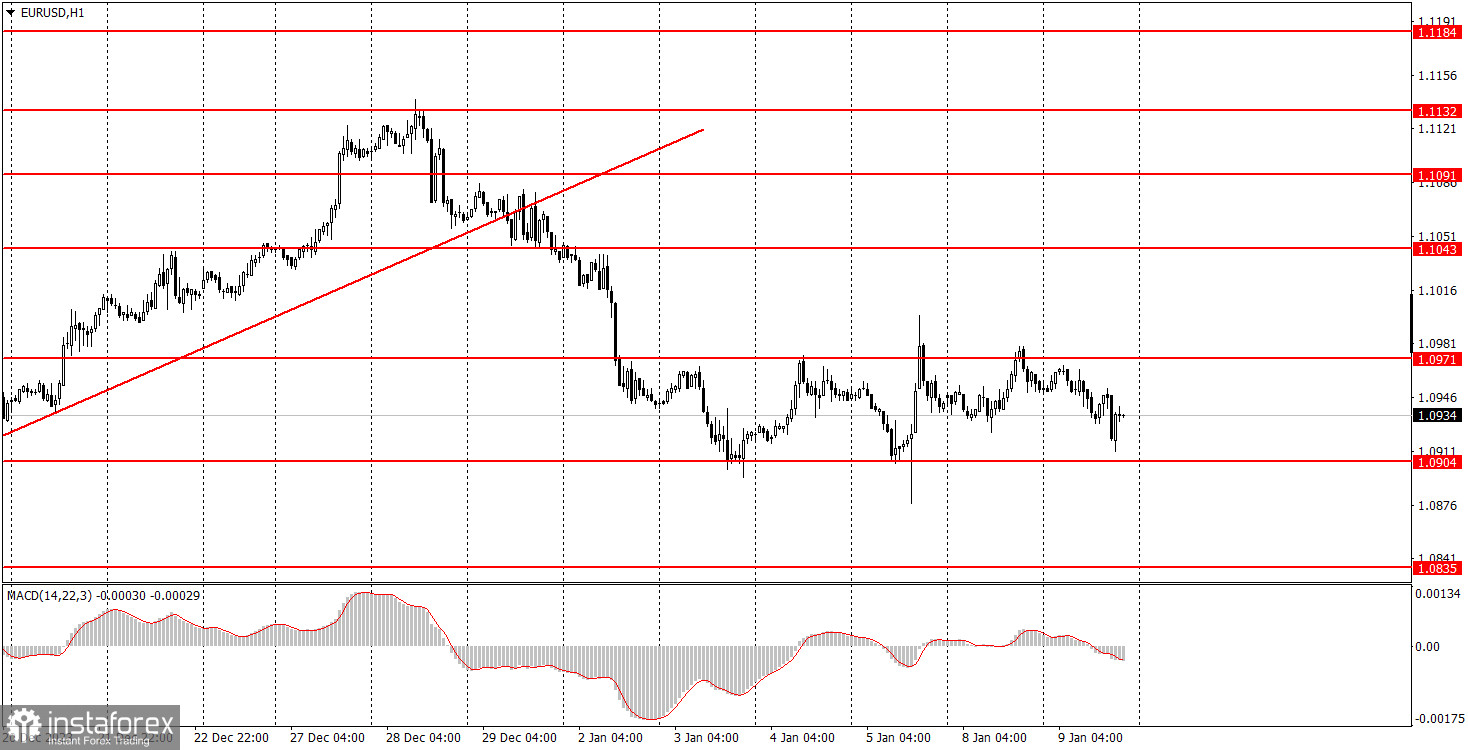
On the hourly chart, EUR/USD finally has a chance to form a downtrend. The downtrend persists, although the price has spent the last four days in a flat range. Nevertheless, there are still few reasons for the euro to rise, so we expect the pair to trade lower.
We will base our analysis on the 1.0904-1.0971 range. A rebound occurred from the upper band of this channel, so we expect the price to fall to the lower band, from which there could also be a rebound. There are very few important events this week, so the market may push the pair based solely on technical factors. On Wednesday, either the price will settle below the sideways channel or it will bounce from 1.0904 and head towards 1.0971 again.
The key levels on the 5M chart are 1.0733, 1.0767-1.0781, 1.0835, 1.0896-1.0904, 1.0940, 1.0971-1.0981, 1.1011, 1.1043, 1.1091, 1.1132-1.1145, 1.1184, 1.1241, 1.1279-1.1292. On Wednesday, there are no important events scheduled in either the European Union or the United States. The pair's movements could be very weak and within the sideways channel.
1) Signal strength is determined by the time taken for its formation (either a bounce or level breach). A shorter formation time indicates a stronger signal.
2) If two or more trades around a certain level are initiated based on false signals, subsequent signals from that level should be disregarded.
3) In a flat market, any currency pair can produce multiple false signals or none at all. In any case, the flat trend is not the best condition for trading.
4) Trading activities are confined between the onset of the European session and mid-way through the U.S. session, after which all open trades should be manually closed.
5) On the 30-minute timeframe, trades based on MACD signals are only advisable amidst substantial volatility and an established trend, confirmed either by a trendline or trend channel.
6) If two levels lie closely together (ranging from 5 to 15 pips apart), they should be considered as a support or resistance zone.
Support and Resistance price levels can serve as targets when buying or selling. You can place Take Profit levels near them.
Red lines represent channels or trend lines, depicting the current market trend and indicating the preferable trading direction.
The MACD(14,22,3) indicator, encompassing both the histogram and signal line, acts as an auxiliary tool and can also be used as a signal source.
Significant speeches and reports (always noted in the news calendar) can profoundly influence the price dynamics. Hence, trading during their release calls for heightened caution. It may be reasonable to exit the market to prevent abrupt price reversals against the prevailing trend.
Beginning traders should always remember that not every trade will yield profit. Establishing a clear strategy coupled with sound money management is the cornerstone of sustained trading success.
InstaForex analytical reviews will make you fully aware of market trends! Being an InstaForex client, you are provided with a large number of free services for efficient trading.


