 Stay
Stay 
Trading Conditions
Products
Tools


EUR/USD continued to trade within the same sideways channel of 1.0904-1.0971. By the end of the day, the price reached the upper band of the channel once again. If the price rebounds from it, then it could move back towards the lower band of the channel. Overall, the market is in a flat phase, with very low volatility. On Wednesday, the pair was unable to cover even 50 pips from the daily low to the daily high. Therefore, at this time, the euro has not started a corrective move or a trend.
There were no noteworthy macroeconomic events. The only fundamental event was the speech of European Central Bank Vice President Luis de Guindos, which did not provide any distinct information to the market. Therefore, we witnessed another dull day. We still believe that the EUR/USD pair should fall, as we do not see any reasons for the euro to strengthen. With each passing day, the likelihood of a first Federal Reserve rate cut in March becomes smaller and smaller. The market does not really believe that the rate cut cycle will start later on, but the scales are still leaning in favor of the dollar.
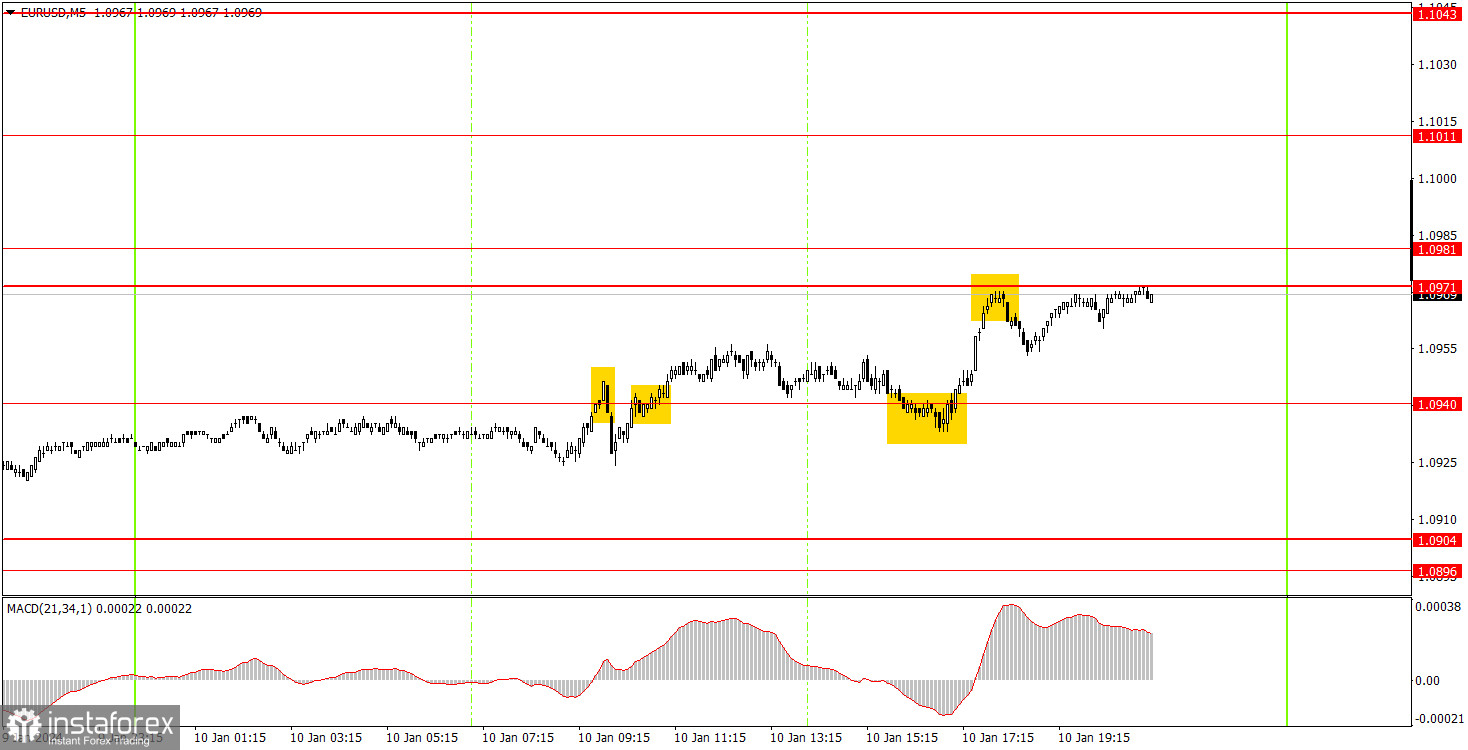
Several trading signals were formed on the 5-minute chart, but the movement was very weak. Initially, the pair bounced off the level of 1.0940 but could not fall by 15 pips. This short position closed with a small loss. Next, there was a break above the level of 1.0940, followed by a rebound from this level during the US session. Based on these two buy signals, one could open a long position as they confirmed each other. Within half an hour, the price rose to the level of 1.0971, where long positions could be closed, and traders could leave the market. We shouldn't expect a strong movement.
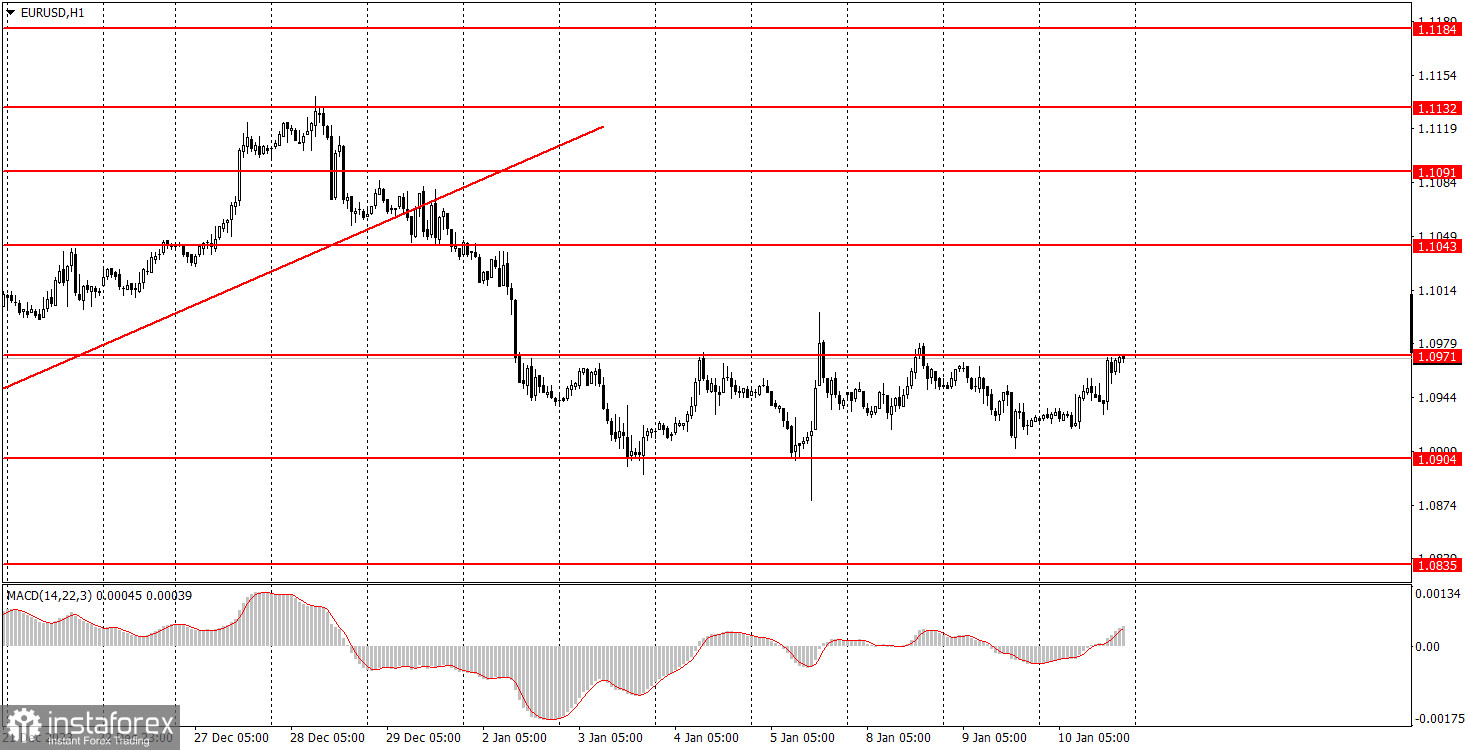
On the hourly chart, EUR/USD finally has a chance to form a downtrend, but it has spent the last five days in a total flat. Nevertheless, the euro doesn't have much reasons to strengthen, so we expect the downtrend to persist.
We will consider the range of 1.0904-1.0971. A new rebound can take place from the upper band of this channel, so we expect the price to fall towards the lower band. If it surpasses the 1.0971 mark, you can work on the upside with 1.1011 as a target. There are very few important events this week, so movements may remain relatively weak.
The key levels on the 5M chart are 1.0733, 1.0767-1.0781, 1.0835, 1.0896-1.0904, 1.0940, 1.0971-1.0981, 1.1011, 1.1043, 1.1091, 1.1132-1.1145, 1.1184, 1,1241, 1,1279-1,1292. On Thursday, the most important and essentially the only key report of the week will be published - the US Consumer Price Index. This is an important report that can trigger a strong market reaction. The US CPI may rise in December, which should support the US dollar.
1) Signal strength is determined by the time taken for its formation (either a bounce or level breach). A shorter formation time indicates a stronger signal.
2) If two or more trades around a certain level are initiated based on false signals, subsequent signals from that level should be disregarded.
3) In a flat market, any currency pair can produce multiple false signals or none at all. In any case, the flat trend is not the best condition for trading.
4) Trading activities are confined between the onset of the European session and mid-way through the U.S. session, after which all open trades should be manually closed.
5) On the 30-minute timeframe, trades based on MACD signals are only advisable amidst substantial volatility and an established trend, confirmed either by a trendline or trend channel.
6) If two levels lie closely together (ranging from 5 to 15 pips apart), they should be considered as a support or resistance zone.
Support and Resistance price levels can serve as targets when buying or selling. You can place Take Profit levels near them.
Red lines represent channels or trend lines, depicting the current market trend and indicating the preferable trading direction.
The MACD(14,22,3) indicator, encompassing both the histogram and signal line, acts as an auxiliary tool and can also be used as a signal source.
Significant speeches and reports (always noted in the news calendar) can profoundly influence the price dynamics. Hence, trading during their release calls for heightened caution. It may be reasonable to exit the market to prevent abrupt price reversals against the prevailing trend.
Beginning traders should always remember that not every trade will yield profit. Establishing a clear strategy coupled with sound money management is the cornerstone of sustained trading success.
InstaForex analytical reviews will make you fully aware of market trends! Being an InstaForex client, you are provided with a large number of free services for efficient trading.

