 Stay
Stay 
Trading Conditions
Products
Tools


The GBP/USD pair showed mixed movements on Friday. The British pound fell in the first half of the day due to another disappointing report in the UK, while the price recovered in the second half, as the market still seems reluctant to sell the pound in the medium term. The UK's retail sales report turned out to be much weaker than expected, which justified the pound's decline. However, U.S. data could have triggered the dollar's growth, but this did not happen.
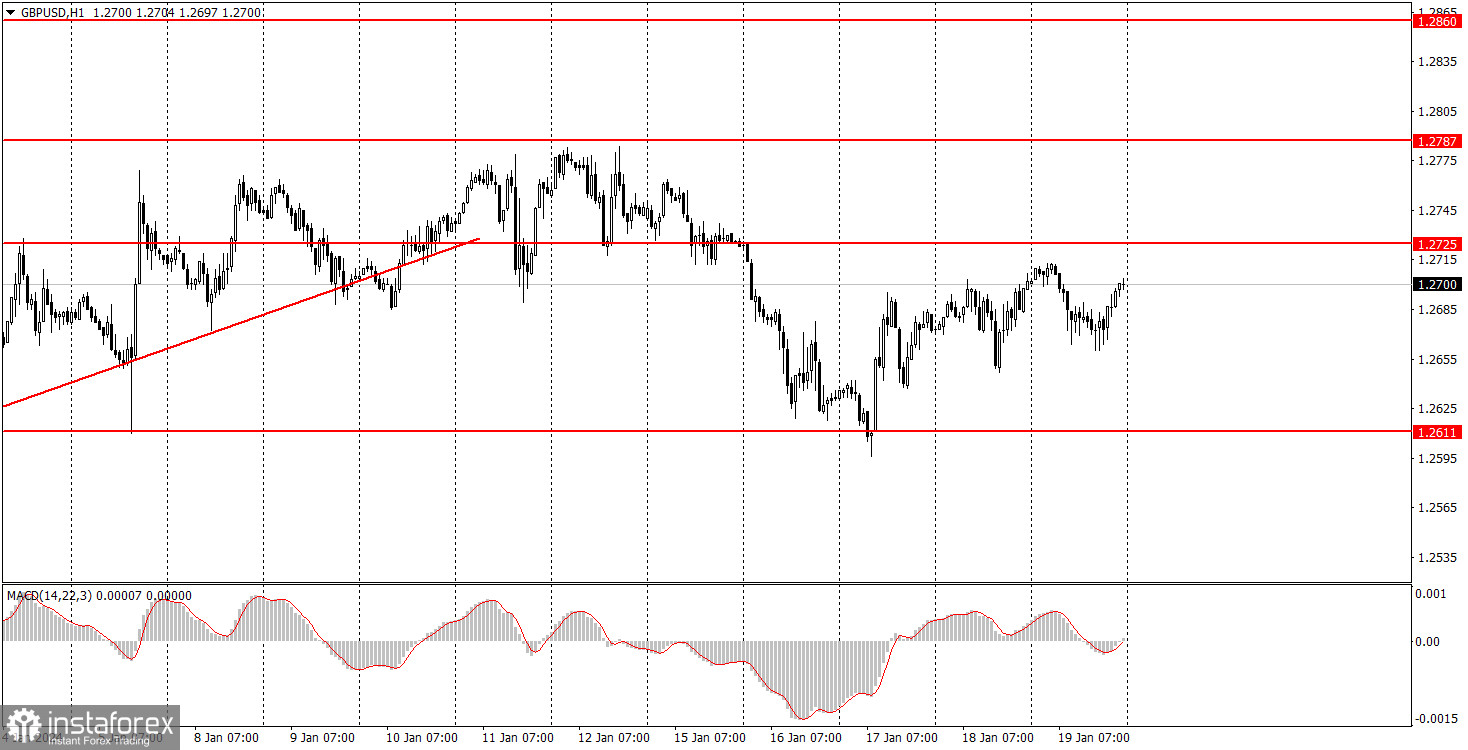
Nevertheless, the pair remains within the sideways channel of 1.2611-1.2787. Therefore, any movements within this channel generally represents a flat. The price can fluctuate within this range as it pleases. It doesn't make sense to discuss the impact of the economic background on the pair's movement right now, as we have been observing a clear flat for over a month. Perhaps the meetings of the Bank of England and the Federal Reserve will change the situation, but one can only count on statements regarding future changes in monetary policy made by Jerome Powell and Andrew Bailey.
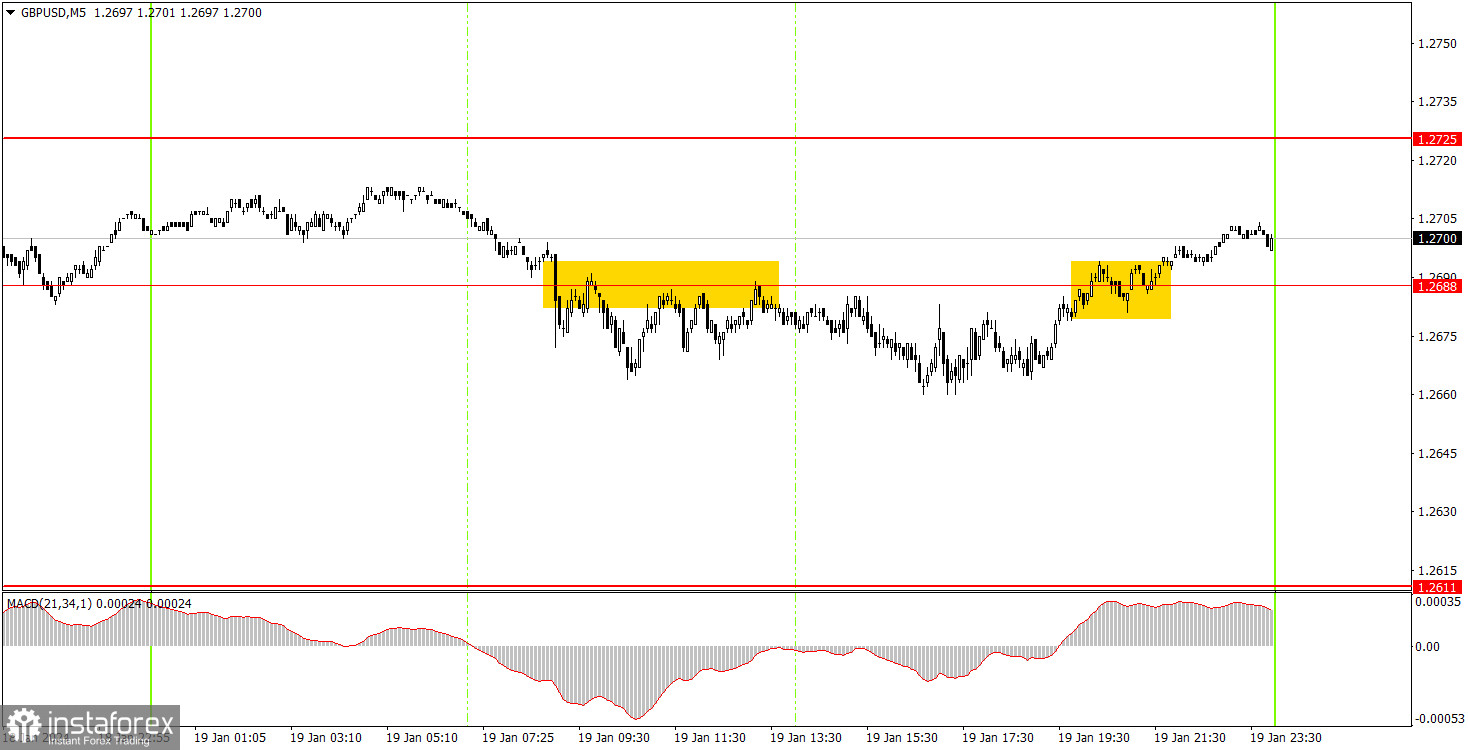
The pair's movements on the 5-minute timeframe were not the best, and the trading signals followed suit. During the European session, the price repeatedly bounced off the level of 1.2688, but we did not see a strong downward movement. Beginners could open short positions, but the pound managed to fall by only 20 pips, and not on the first attempt. The volatility was around 50 pips, which is very low. Therefore, the stop loss for the only short position was set to break even, and the trade was closed. At the very end of the day, the pair settled above the level of 1.2688, but this signal was generated too late, so it should not have been traded.
On the hourly chart, GBP/USD is still trading within the sideways channel of 1.2611-1.2787. The price has rebounded from the 1.2611 level five times, and a new uptrend has started within the flat, which is clearly visible on the 4-hour chart. Now the price can continue to gradually rise towards the upper band of the sideways channel.
On Monday, there's a good chance that the British pound will likely remain within the sideways channel. There are no important fundamental or macroeconomic events in either the U.S. or the UK, so we shouldn't expect strong growth or decline. The price is practically in the middle of the channel, so there's a low chance of breaking out of it.
The key levels on the 5M chart are 1.2270, 1.2310, 1.2372-1.2387, 1.2457, 1.2502, 1.2544, 1.2605-1.2611, 1.2688, 1.2725, 1.2787-1.2791, 1.2848-1.2860, 1.2913, 1.2981-1.2993. There are no important events lined up in either the UK or the U.S. on Monday. Therefore, volatility will likely remain low, and it will be very difficult to expect good trends.
1) Signal strength is determined by the time taken for its formation (either a bounce or level breach). A shorter formation time indicates a stronger signal.
2) If two or more trades around a certain level are initiated based on false signals, subsequent signals from that level should be disregarded.
3) In a flat market, any currency pair can produce multiple false signals or none at all. In any case, the flat trend is not the best condition for trading.
4) Trading activities are confined between the onset of the European session and mid-way through the U.S. session, after which all open trades should be manually closed.
5) On the 30-minute timeframe, trades based on MACD signals are only advisable amidst substantial volatility and an established trend, confirmed either by a trendline or trend channel.
6) If two levels lie closely together (ranging from 5 to 15 pips apart), they should be considered as a support or resistance zone.
Support and Resistance price levels can serve as targets when buying or selling. You can place Take Profit levels near them.
Red lines represent channels or trend lines, depicting the current market trend and indicating the preferable trading direction.
The MACD(14,22,3) indicator, encompassing both the histogram and signal line, acts as an auxiliary tool and can also be used as a signal source.
Significant speeches and reports (always noted in the news calendar) can profoundly influence the price dynamics. Hence, trading during their release calls for heightened caution. It may be reasonable to exit the market to prevent abrupt price reversals against the prevailing trend.
Beginners should always remember that not every trade will yield profit. Establishing a clear strategy coupled with sound money management is the cornerstone of sustained trading success.
InstaForex analytical reviews will make you fully aware of market trends! Being an InstaForex client, you are provided with a large number of free services for efficient trading.

