 Stay
Stay 
Trading Conditions
Products
Tools


EUR/USD revisited the level of 1.0906 for the third time in the last few days and unexpectedly fell. Take note that this happened in the absence of important events and economic reports, so it is quite difficult to determine the reason why the euro rapidly fell. We won't speculate on the reasons for this movement, but we can say that the price remained within the sideways channel of 1.0835-1.0906 at the end of the day. In general, nothing changed even after the price moved by almost 100 pips.
As mentioned earlier, there were no significant events on Tuesday. Perhaps some newcomers thought that such a movement could have been triggered by statements from representatives of the Federal Reserve or the European Central Bank, but we would like to remind you that the ECB meeting will take place this week, and the Fed meeting is scheduled for the next one. Theerefore, the "blackout period" is in effect, and members of the monetary committees are not allowed to comment on interest rates and monetary policy. The euro fell out of nowhere but this still aligns with our expectations.
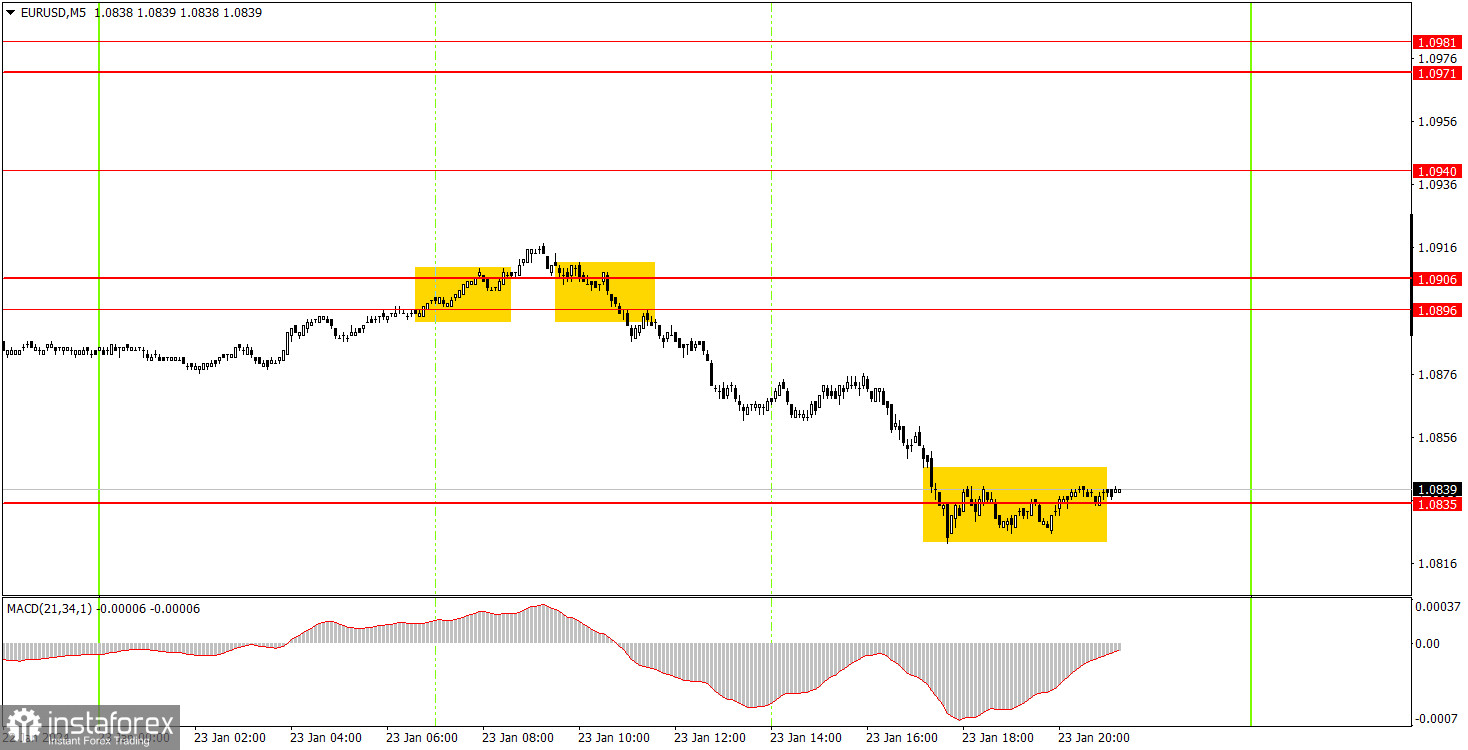
Several signals were generated on the 5-minute timeframe. The first buy signal turned out to be a false signal, but an hour later, a sell signal was formed in the same area of 1.0896-1.0906, which captured the entire downward movement. By the middle of the U.S. trading session, the price had dropped to the level of 1.0935, where it remained for the rest of the day. Therefore, traders could gain around 50 pips of profit from the short position, while there was a loss of about 30 pips from the long position. Not a high amount of profit, but still a profit.
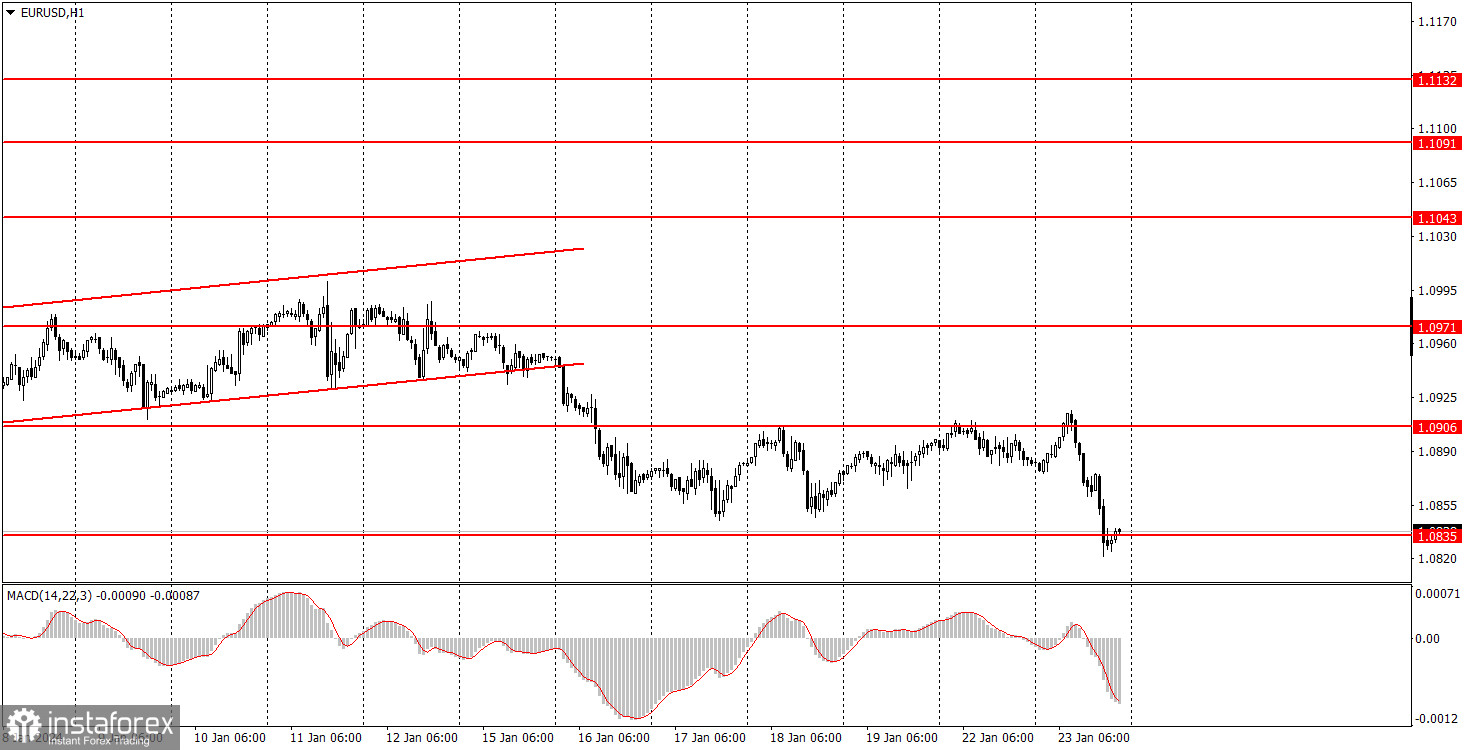
On the hourly chart, EUR/USD still has the potential to form a new downtrend since it settled below the ascending channel. However, at the moment, the pair remains within the sideways channel of 1.0835-1.0906. Therefore, we expect the pair to fall further, but first, the price must leave this range.
On Wednesday, we expect further downward movement since three sell signals were formed in the 1.0896-1.0906 area. However, the price has yet to surpass the level of 1.0835. If the price consolidates below it, you may consider new short positions with a target of 1.0767-1.0781. The bounce from the level of 1.0835 is not clear, and it can't be used for buying at the moment.
The key levels on the 5M chart are 1.0668, 1.0733, 1.0767-1.0781, 1.0835, 1.0896-1.0904, 1.0940, 1.0971-1.0981, 1.1011, 1.1043, 1.1091, 1.1132-1.1145, 1.1184. On Wednesday, PMI data on the service and manufacturing sectors will be published in the European Union and the United States. These are not crucial reports, but their values can resonate and provoke a market reaction. So be attentive!
1) Signal strength is determined by the time taken for its formation (either a bounce or level breach). A shorter formation time indicates a stronger signal.
2) If two or more trades around a certain level are initiated based on false signals, subsequent signals from that level should be disregarded.
3) In a flat market, any currency pair can produce multiple false signals or none at all. In any case, the flat trend is not the best condition for trading.
4) Trading activities are confined between the onset of the European session and mid-way through the U.S. session, after which all open trades should be manually closed.
5) On the 30-minute timeframe, trades based on MACD signals are only advisable amidst substantial volatility and an established trend, confirmed either by a trendline or trend channel.
6) If two levels lie closely together (ranging from 5 to 15 pips apart), they should be considered as a support or resistance zone.
Support and Resistance price levels can serve as targets when buying or selling. You can place Take Profit levels near them.
Red lines represent channels or trend lines, depicting the current market trend and indicating the preferable trading direction.
The MACD(14,22,3) indicator, encompassing both the histogram and signal line, acts as an auxiliary tool and can also be used as a signal source.
Significant speeches and reports (always noted in the news calendar) can profoundly influence the price dynamics. Hence, trading during their release calls for heightened caution. It may be reasonable to exit the market to prevent abrupt price reversals against the prevailing trend.
Beginning traders should always remember that not every trade will yield profit. Establishing a clear strategy coupled with sound money management is the cornerstone of sustained trading success.
InstaForex analytical reviews will make you fully aware of market trends! Being an InstaForex client, you are provided with a large number of free services for efficient trading.

