 Stay
Stay 
Trading Conditions
Products
Tools


GBP/USD tried to extend the upward movement on Tuesday, but it plunged after the U.S. inflation report, just like the EUR/USD pair. We have already discussed the reasons why the dollar rose so sharply and strongly, so we will not repeat ourselves. Let's just say that from a technical perspective, absolutely nothing has changed. So now the pair may start a new round of decline, which would be logical and reasonable from all sides. However, we strongly doubt that the market is ready to sell the pound.
Yes, the pair has consolidated below the notorious 1.2611 level, but it also consolidated below it a week ago, and the pair did not continue the downward movement. Yes, the pair left the sideways channel, but, in fact, the nature of the movement has not changed - we still don't see a trend. And we've seen the same situation for two months now. This should be taken into account when you open any trades.
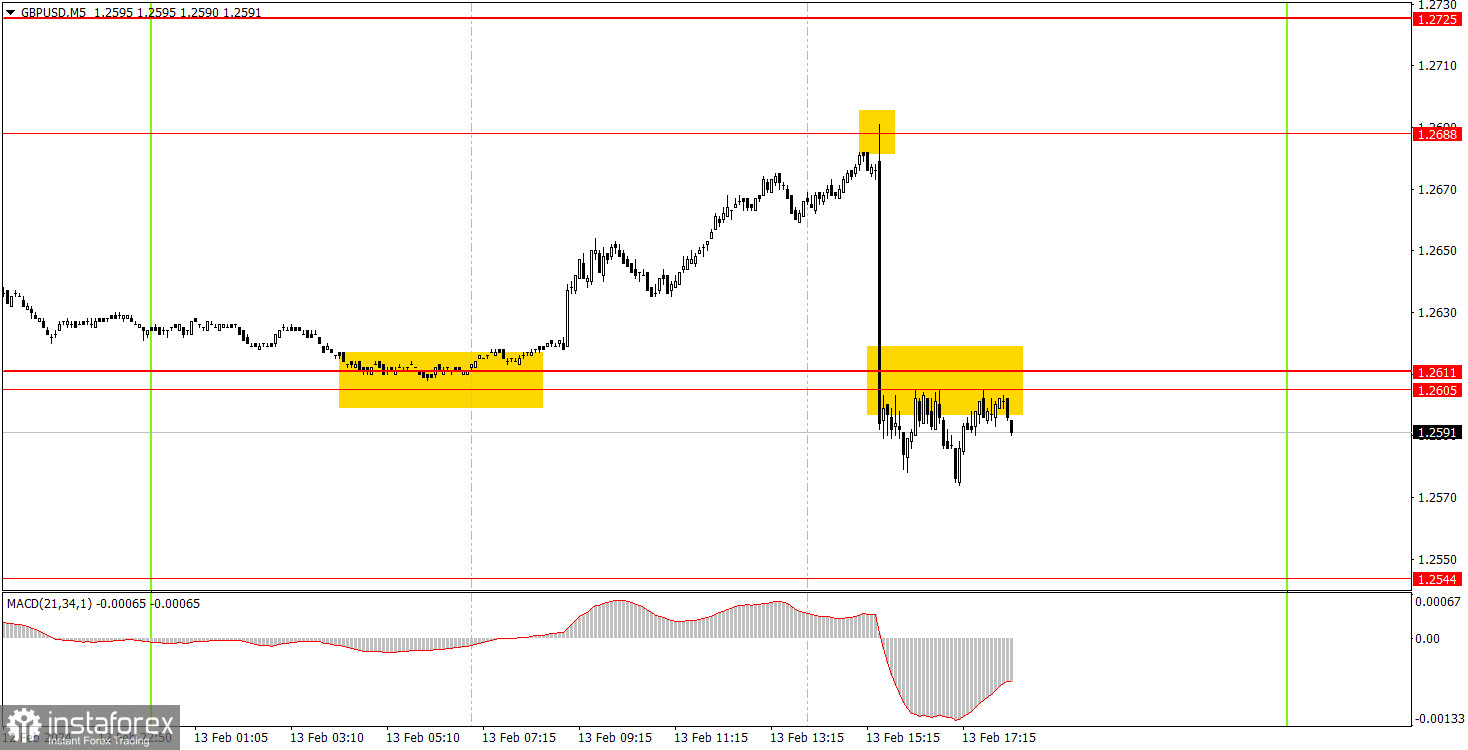
GBP/USD generated two signals on the 5-minute timeframe. In the morning, the pair rebounded from the area of 1.2605-1.2611, after which it managed to rise to the level of 1.2688, from which it also bounced back perfectly in terms of accuracy. In the morning, the UK released reports that influenced traders' sentiment. We cannot say that it completely supported the pound, but after the buy signal, the pair's growth was very timely. Long positions should have been closed before the inflation report was published. The profit was around 60 pips. It was very difficult to react to the sell signal near the level of 1.2688, but those who managed to do so received high profit. Consolidation below the area of 1.2605-1.2611 did not produce anything, as the movement ended there.
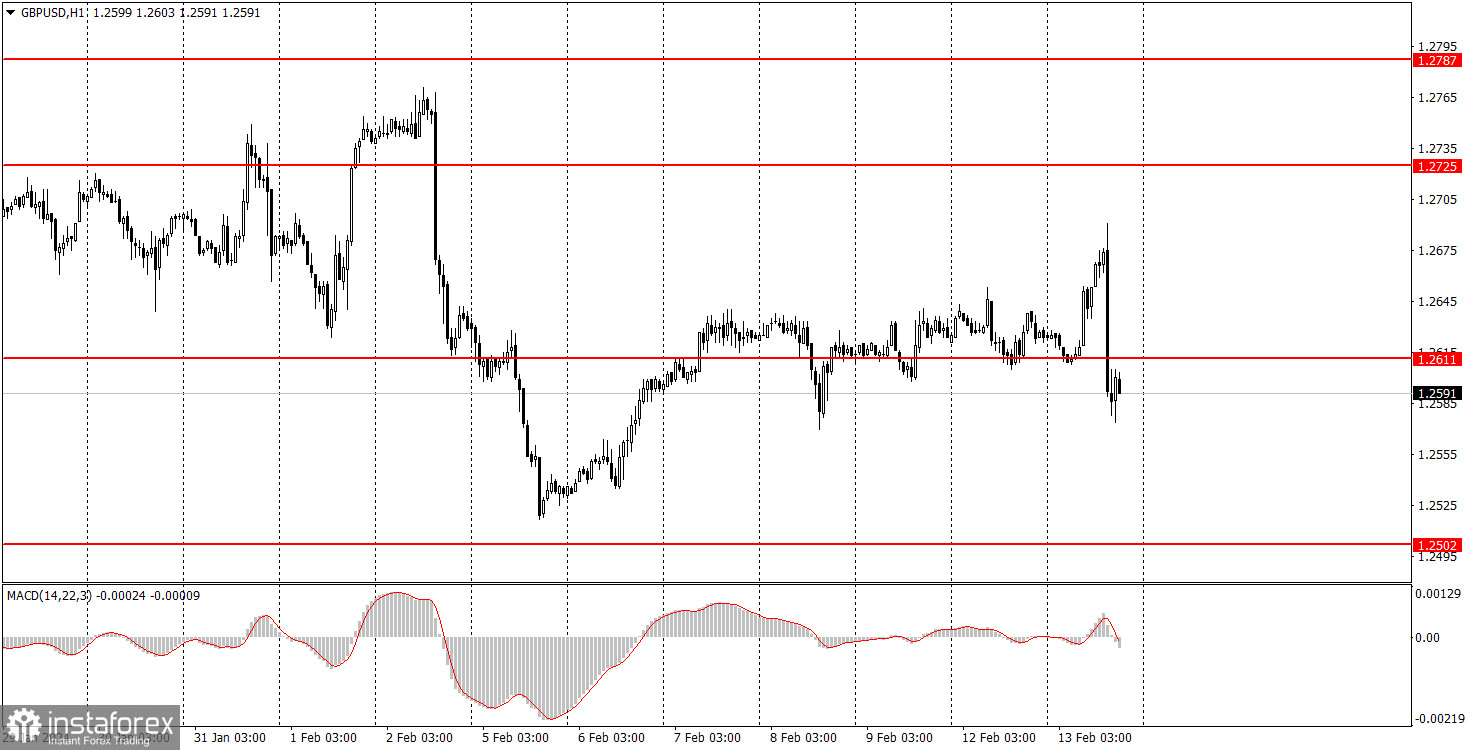
On the hourly chart, GBP/USD left the sideways channel of 1.2611-1.2787 but has already returned to it. The most important thing is that the nature of the pound's movement has not changed at all. On Tuesday, the pound grew and also fell due to the strong macroeconomic background. The flat phase may resume on Wednesday. However, we can also expect new flights since the background will be strong.
The key levels on the 5M chart are 1.2270, 1.2310, 1.2372-1.2387, 1.2457, 1.2502, 1.2544, 1.2605-1.2611, 1.2688, 1.2725, 1.2787-1.2791, 1.2848-1.2860, 1.2913, 1.2981-1.2993. On Wednesday, the UK will publish the inflation report for January. Market players expect the indicator to accelerate, which may provoke the pound's rise. If this does not happen, the pound may fall further, which would be very logical.
1) Signal strength is determined by the time taken for its formation (either a bounce or level breach). A shorter formation time indicates a stronger signal.
2) If two or more trades around a certain level are initiated based on false signals, subsequent signals from that level should be disregarded.
3) In a flat market, any currency pair can produce multiple false signals or none at all. In any case, the flat trend is not the best condition for trading.
4) Trading activities are confined between the onset of the European session and mid-way through the U.S. session, after which all open trades should be manually closed.
5) On the 30-minute timeframe, trades based on MACD signals are only advisable amidst substantial volatility and an established trend, confirmed either by a trendline or trend channel.
6) If two levels lie closely together (ranging from 5 to 15 pips apart), they should be considered as a support or resistance zone.
Support and Resistance price levels can serve as targets when buying or selling. You can place Take Profit levels near them.
Red lines represent channels or trend lines, depicting the current market trend and indicating the preferable trading direction.
The MACD(14,22,3) indicator, encompassing both the histogram and signal line, acts as an auxiliary tool and can also be used as a signal source.
Significant speeches and reports (always noted in the news calendar) can profoundly influence the price dynamics. Hence, trading during their release calls for heightened caution. It may be reasonable to exit the market to prevent abrupt price reversals against the prevailing trend.
Beginners should always remember that not every trade will yield profit. Establishing a clear strategy coupled with sound money management is the cornerstone of sustained trading success.
InstaForex analytical reviews will make you fully aware of market trends! Being an InstaForex client, you are provided with a large number of free services for efficient trading.

