 Stay
Stay 
Trading Conditions
Products
Tools


GBP/USD also experienced a slight bullish correction on Thursday. In the first half of the day, the British currency fell as the UK GDP report for the fourth quarter turned out to be much weaker than expected. If there is no talk of a recession in Britain yet, it is only by pure chance. However, the pound only fell for a short period, as during the U.S. trading session, even weaker reports on industrial production and retail sales were published. Therefore, the dollar was already falling in the second half of the day. In general, we witnessed absolutely logical and justified movements, something that the GBP/USD pair cannot boast of at all times.
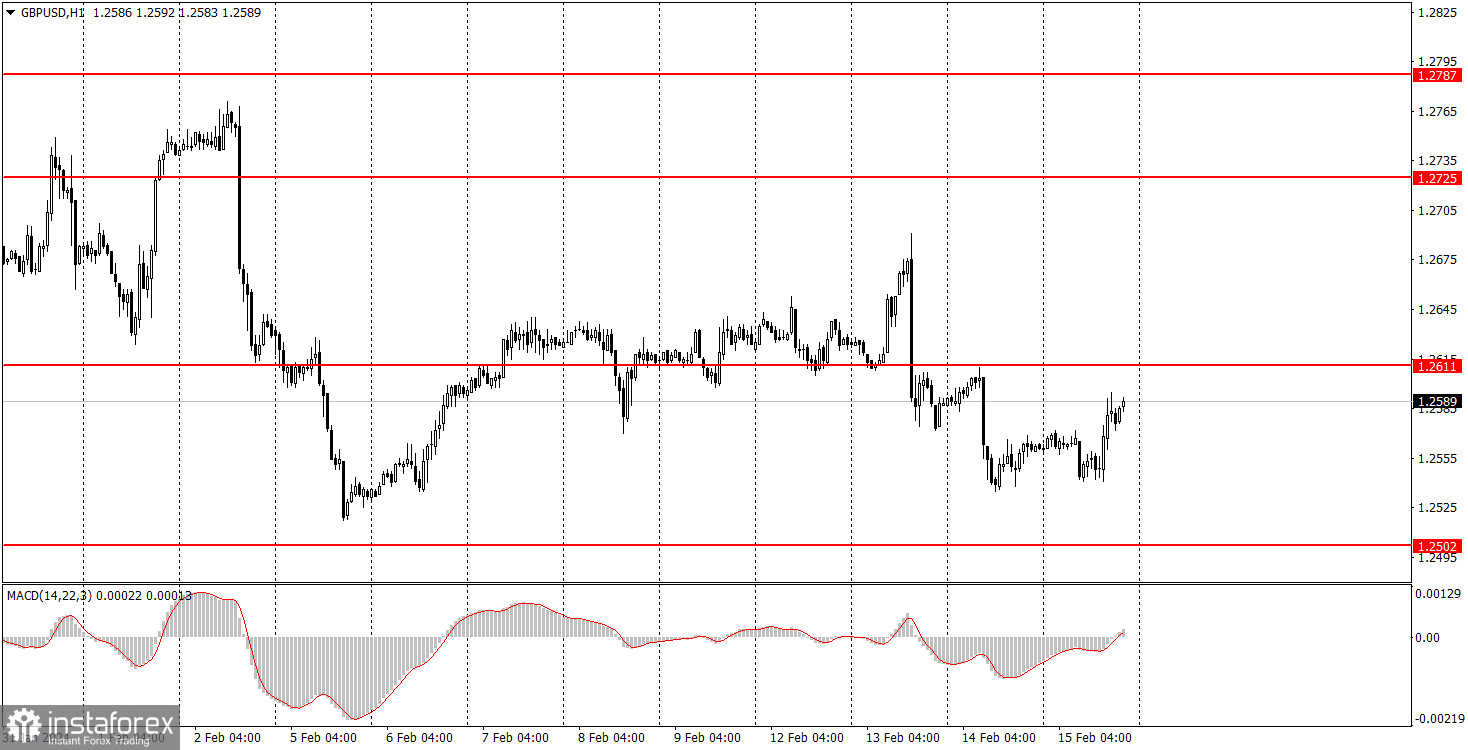
We expect the pound to exhibit downward movements. The most important reports of the week have shown that the pound has a potential to fall further, and it has been there for a very long time. However, first and foremost, the pair needs to fall at least to the level of 1.2502.
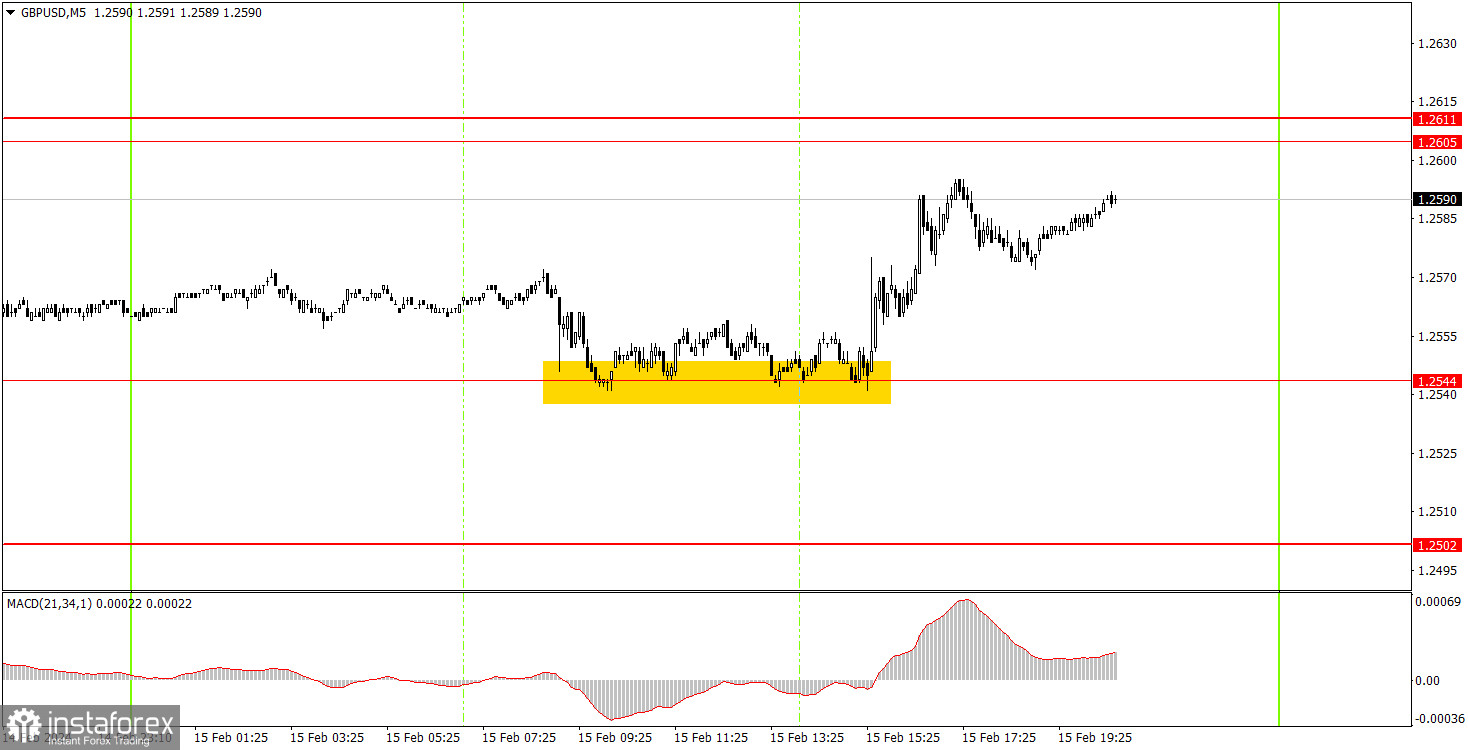
Only one signal was generated on the 5-minute timeframe - a buy signal. It was forming for about five or six hours during which the price repeatedly bounced from the level of 1.2544. Therefore, beginners could open a long position at the beginning of the U.S. session (or earlier), and by the end of the day, the pound had managed to rise by 35-40 pips. The single trade brought a fairly good profit.
On the hourly chart, GBP/USD left the sideways channel of 1.2611-1.2787 and is making every effort to start a downtrend. However, the pound recently declined due to a strong macroeconomic background. On Thursday, the news mostly supported the pound, so the British currency stopped falling. In general, the pound continues to move erratically and in a limited price range.
The key levels on the 5M chart are 1.2270, 1.2310, 1.2372-1.2387, 1.2457, 1.2502, 1.2544, 1.2605-1.2611, 1.2688, 1.2725, 1.2787-1.2791, 1.2848-1.2860, 1.2913, 1.2981-1.2993. On Friday, the UK will release an important report on retail sales. If this report turns out to be stronger than forecasts (which is unlikely), the pound will continue to rise. The U.S. will release reports on PPI, Building Permits, and Consumer Sentiment. These are equivalent to Thursday's reports, so they could provide fresh impetus.
1) Signal strength is determined by the time taken for its formation (either a bounce or level breach). A shorter formation time indicates a stronger signal.
2) If two or more trades around a certain level are initiated based on false signals, subsequent signals from that level should be disregarded.
3) In a flat market, any currency pair can produce multiple false signals or none at all. In any case, the flat trend is not the best condition for trading.
4) Trading activities are confined between the onset of the European session and mid-way through the U.S. session, after which all open trades should be manually closed.
5) On the 30-minute timeframe, trades based on MACD signals are only advisable amidst substantial volatility and an established trend, confirmed either by a trendline or trend channel.
6) If two levels lie closely together (ranging from 5 to 15 pips apart), they should be considered as a support or resistance zone.
Support and Resistance price levels can serve as targets when buying or selling. You can place Take Profit levels near them.
Red lines represent channels or trend lines, depicting the current market trend and indicating the preferable trading direction.
The MACD(14,22,3) indicator, encompassing both the histogram and signal line, acts as an auxiliary tool and can also be used as a signal source.
Significant speeches and reports (always noted in the news calendar) can profoundly influence the price dynamics. Hence, trading during their release calls for heightened caution. It may be reasonable to exit the market to prevent abrupt price reversals against the prevailing trend.
Beginners should always remember that not every trade will yield profit. Establishing a clear strategy coupled with sound money management is the cornerstone of sustained trading success.
InstaForex analytical reviews will make you fully aware of market trends! Being an InstaForex client, you are provided with a large number of free services for efficient trading.


